Chakradhar Mattupalli, Michael R. Komp, and Carolyn A. Young,
Noble Research Institute, LLC, Ardmore, OK 73401, USA
Mattupalli, C., Komp, M. R., and Young, C. A. 2017. Integrating geospatial technologies and unmanned aircraft systems into the grower’s disease management toolbox. APS Features. doi:10.1094/APSFeature-2017-7.
Current agricultural production is at an interesting crossroads. On one hand there is a need to meet the growing demand from the prospering population for food and dairy products. On the other, a growing list of factors such as globalization, climate change, limited availability of land and water resources, unsustainable land management practices, pathogens and pests developing resistance to chemical pesticides, and emergence of pathogens adapting to new hosts all challenge food security and sustainable food production.
Over the last decade, there has been an increasing interest among growers in adopting precision agriculture, a crop-management system based on spatial and temporal heterogeneity of soil and crops within a field (Stafford 2000). Precision agriculture is also being advocated as a future agricultural procedure that would allow sustainable feeding of the world population. Although the concept of within-field spatial variability is age-old, remarkable technological advances in the fields of geographic information systems (GIS), global positioning systems (GPS), and remote sensing has brought renewed interest in this concept, providing interesting opportunities for plant pathologists and growers. Our goal with this article is to provide readers with a snapshot of geospatial technologies and their potential applications in plant disease management in the near future.
Background
Geographic Information Systems utilize data with positional information to understand how spatial relationships between different phenomena impact each other. Historically, these systems relied exclusively on desktop and laptop computer systems for creating, viewing, analyzing, and reporting information. Today, GIS utilizes a wide range of input devices, including phones, unmanned aircraft systems (UAS), GPS devices, and many types of sensors, all of which allow us to navigate more effectively, quarantine and stop diseases, and make better economic decisions. In agriculture, this means that farmers and ranchers can more quickly visualize imagery to make decisions, which should lead to more efficient and profitable operations. Examples of research that has integrated GIS data include forecasting models to estimate global severity of diseases such as late blight of potato (Hijmans et al. 2000) and identifying oversummering regions of wheat powdery mildew pathogen in China (Li et al. 2013).
GPS-collected data are a cornerstone of most GIS, and the devices to gather GPS data have advanced tremendously in recent years. With the advent of GPS-enabled smartphones, the potential to gather GPS data has grown substantially. At global and regional scales, this allows citizens to take part in disease monitoring. Indeed, many citizen-science monitoring projects help us track invasive plants and animals that negatively affect agricultural production. The real-time spatial accuracy of some GPS units is down to centimeters; at a local, farm, or research-plot scale, this type of accuracy enables precision applications of GIS technologies that were once considered to be unachievable. This advancement of technology has enabled precision applications of pesticides and fertilizers, which limits inputs and results in reduced production costs.
Remote sensing, specifically the ability to discern actionable information from data collected using sensors via air or satellite, provides huge value in agriculture. Remote sensing involves acquiring information about objects without contact using sensors that measure differential spectral and thermal reflectances and emittances. Digital cameras are the most common RGB sensors used in remote sensing; they capture information in the blue, green, and red regions of the spectrum. Often, basic RGB sensors only tell part of the story and multi-spectral sensors, which assess discrete broad wavelengths in the visible and infrared regions, provide additional and more specific information. An example of a multi-spectral sensor is one that is capable of taking images in four discrete bands such as red, green, blue, and near-infrared regions of the spectrum. In contrast, hyperspectral sensors deal with continuous spectral bands with a narrow resolution thereby providing subtle spectral details. Unfortunately, the added detail provided by the hyperspectral sensors is accompanied by greater expense for the camera. The optical properties of a plant are influenced by leaf water and chemical composition as well as pigmentation. For example, high absorption by chlorophyll and other plant pigments render healthy green plants with low reflectance and transmittance in the visible region of the spectrum (400 to 700 nm). Conversely, high reflectance in the near infrared (700 to 1100 nm) region is attributed to intercellular spaces. Plant stresses caused by various biotic and abiotic factors lead to differences in reflectance between visible and near infrared wavelengths. These differences in reflectance can be used to calculate vegetation indices, which give an indication of plant health. To gain deeper understanding of different kinds of sensors and their applications in the field of plant pathology, readers should refer to reviews by Mahlein (2016) and Simko et al. (2017).
In the last year, the sensor industry has bloomed, with UAS driving the demand for better sensors for agricultural purposes. In addition, sensors such as Light Detection and Ranging (LIDAR) that were once very expensive are now far more affordable. Remote sensing facilitates repeated and non-destructive data collection using sensors mounted on various platforms such as hand-held devices (Nutter et al. 2002), tractors (Pittman et al. 2016), high-throughput overhead platforms, satellites, and unmanned aircraft systems. In view of their usage and popularity, we will focus on the latter two platforms.
Satellite Imagery
Along with the artificial satellites launched into earth’s orbit to explore space, understand the universe, and improve communication, weather monitoring, surveillance, and navigation, a suite of Landsat satellites equipped with a multitude of sensors has been imaging the earth’s surface since 1972. These medium spatial resolution Landsat images collected at different wavelengths (resolution ranges from 15 m to 60 m depending on the Landsat satellite) can be used to analyze vegetation, map forests, detect clouds, estimate ground temperature, and analyze drought-affected crops (USGS 2016a). Whether it is to assess the extent of damage caused by natural disasters such as a tsunami or to gain information about armed attacks on civilians in inaccessible areas, remote sensing data collected as images from space have been a valuable resource in conducting global research studies. More specifically in agriculture, Landsat images are being used to generate crop production and yield reports, and to help insurance agencies to assess crop losses due to hail or drought (USGS 2016b).
Over the past 45 years, the Landsat program has been a repository of millions of square kilometers of earth images that were taken in different spectral bands. These publicly available archived images are an invaluable means for researchers to travel back in time and study changes in agricultural land patterns or effects of climate changes. However, some of the limitations of Landsat images include cloud cover compromising image quality, a longer revisit interval period, and medium-resolution images. These limitations are offset by the availability of centimeter-resolution images from private companies whereby the user is charged the expense of accessing images on a square-kilometer basis. Nonetheless, the utility of satellite images cannot be underestimated. For example, Landsat 5 Thematic Mapper images were used to detect and quantify wheat fields affected with Wheat streak mosaic virus in two counties in Texas (Mirik et al. 2011) and Google Earth images were utilized in the District of Columbia to identify leaf-scorched trees that were potentially infected with Xylella fastidiosa (Harris et al. 2014).
Unmanned Aircraft System (UAS): A Tool with Many Applications
Once best known as a military surveillance tool, the UAS (commonly referred to as unmanned aerial vehicle [UAV] or drone) has more recently become popular as a recreational device and has also been put to good use in many industries, including agriculture, law enforcement, aerial imaging/mapping, and television. The Association for Unmanned Vehicle Systems International (AUVSI) predicts the total economic benefit of UAS in the US will exceed $80 billion by 2025 (Jenkins and Vasigh 2013).
UAS platforms have the potential to reduce time-consuming, cost-prohibitive, and labor-intensive ground based surveillance. This is evident from the growing number of UAS applications that include monitoring hazardous environments, inspecting bridges and pipelines, use as aerosol sampling platforms, deployment in search and rescue operations, and making rapid damage assessments (Eninger and Johnson 2015). UAS are also being utilized in human disease epidemiological studies. For instance, UAS were utilized to spatially map changing land use patterns to understand the epidemiology of Plasmodium knowlesi, an emerging malarial parasite in Southeast Asia (Fornace et al. 2014). In the wildlife discipline, UAS offer an excellent low-cost alternative for surveying wild animals over large open landscapes with minimal intrusion (Barasona et al. 2014).
Generally, UAVs can be categorized as either fixed-wing or rotary (Fig. 1). Fixed-wing UAVs resemble a plane, with propellers that thrust and move air below a wing to generate lift. These devices usually have a payload in the belly of the device that includes various sensors and batteries. Rotary devices utilize propellers situated parallel to the ground that lift the device similar to a helicopter and sensors are usually affixed to the device using gimbals (mechanical devices that allow sensors to maintain a desired orientation for capturing data while the UAV is in motion). There are advantages to both of these types of UAVs. Fixed-wing devices generally have longer flight times and are more suitable for larger operations. Rotary devices are more maneuverable and generally require less training to operate.
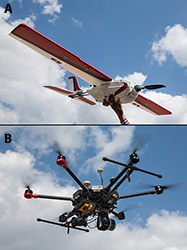 |
Fig. 1. Fixed-wing (A) and rotary-
wing (B) unmanned aerial vehicles. |
Within agriculture, the applications of UAS are broad, but can be segmented into two general categories, remote sensing and precision application (Jenkins and Vasigh 2013). UAS have been employed to map weed infestations, estimate biomass, profile orchard canopies, identify nutrient and drought stresses, and assess irrigation systems (Zhang and Kovacs 2012). UAS is a convenient platform for acquiring information from both small plot (e.g. research plots) as well as larger field operations. The utilization of UAS is of interest to farmers and ranchers for livestock and materials inventory, inspecting fences and remote infrastructure, and inspecting crop health. UAS obtain data at very high spatial resolutions (as low as a centimeter) depending on the sensors used and the height of the flight. In addition, users have the flexibility to collect data at will, with the only caveat being weather that might hinder flight operations. Automation and ease in collecting data for all the crop growth parameters also propelled UAS usage for high-throughput phenotyping in crop breeding programs.
UAS is also being used to study the long-distance dissemination routes of plant pathogens. The earliest reference to UAS-based spore movement study is the use of the MADDSAP (Microbial Agent Dispensing Drone for Suppression of Agricultural Pests) remote-piloted aircraft for trapping spores of Venturia effusa, causal agent of pecan scab (Gottwald and Tedders 1985). In the present era, more sophisticated unmanned aircraft systems are being coupled with microbe-sampling devices to sample spores of Phytophthora infestans (Techy et al. 2010) and Fusarium graminearum (Tallapragada et al. 2011) from lower atmosphere. Furthermore, F. graminearum spores sampled by UAS were utilized to propose a framework to explain how pathogen spores disperse in complex wind patterns (Schmale and Ross 2015). Knowledge obtained from such studies will improve growers’ timing of pesticide applications, which is based on the knowledge of pathogen movement and prevalence. As advances occur in machine learning, robotics, and the sensors used within UAS, we can expect to see remote sensing and precision application platforms that operate swiftly to identify and remediate problems that agricultural producers have with disease and pests.
Phymatotrichopsis Root Rot: A Case Study
Phymatotrichopsis root rot (PRR) is caused by the soil-borne fungus Phymatotrichopsis omnivora. Interestingly, it affects over 1600 dicotyledonous hosts including cotton and perennial forage crops such as alfalfa but does not cause disease on monocotyledonous hosts (Taubenhaus and Ezekiel 1936). The disease is endemic to the southwestern US and northern Mexico and widespread in alkaline, calcareous soils. Alfalfa production can be limited to two to three years in heavily infested fields, whereas a minimum stand life should reach at least five years. The pathogen attacks alfalfa roots causing vascular discoloration and lesions, and the plants wilt and rapidly die. The disease eventually results in the formation of numerous circular to irregular-shaped diseased areas that expand over each growing season (Fig. 2A). Several reviews are available, which provide a more detailed overview of the PRR disease epidemiology and management, as well as the utilization of genomic approaches to study P. omnivora (Streets and Bloss 1973; Lyda 1978; Uppalapati et al. 2010). There are no known alfalfa cultivars resistant to PRR and the efficacy of the fungicide TOPGUARD (active ingredient, Flutriafol), which is being used successfully to manage PRR in cotton, is currently being tested for alfalfa.
|
|
Fig. 2. Phymatotrichopsis root rot (PRR)
infested alfalfa field. (A) Circular to irregularly
shaped area showing dead alfalfa plants at the
disease front and survivors in the center
resulting from PRR disease. (B) Alfalfa field
(50.4 ha) with center pivot irrigation showing
the impact of PRR (Red River Farm, Burneyville,
OK). Image was taken in September 2015.
Blue color represents the area lost due to flooding. |
Its distinctive pattern of disease foci enables aerial imaging as an effective method to capture PRR disease progress. In fact, aerial photography used to visualize PRR dates back to 1929, and likely represents the first of such report in plant pathology (Taubenhaus et al. 1929; Steddom et al. 2005). Over the past 88 years we have witnessed many technological advances that enable us to attain aerial imagery with a spatial resolution of a few centimeters. Aerial imaging obtained using UAS makes it possible to provide a bird’s eye view of fields over large areas and capture disease progression at multiple time periods.
The utilization of UAS-collected high-resolution aerial imagery in understanding PRR disease spread is demonstrated utilizing a 50.4-hectare alfalfa stand grown with center-pivot irrigation (Fig 2B). Large data sets are generated from UAS imagery that require condensing to a more manageable output, and a typical behind-the-scenes workflow is depicted in Figure 3. The UAS takes aerial images while navigating along a GPS-guided flight path. The number of aerial images collected depend on several variables such as the height at which the UAS is flown, desired spatial resolution, and area to be imaged. These images are stitched in an image processing software (such as Agisoft Photoscan), where the images are adjusted for topography, distortion, and tilt to generate a geometrically corrected orthoimage. This orthoimage is then transferred to GIS software (such as ArcMap) where it is georeferenced based on ground control points or locations with known geographic coordinates. After assigning spatial coordinates to the orthoimage, an unsupervised classification can be performed whereby each pixel in the image is categorized to represent the desired features that need to be discerned. In this case, we were interested in the change in alfalfa production due to the presence of PRR disease, so the image is classified as either green (alfalfa) or brown (bare ground) to produce thematic maps. The extent of damage caused by PRR can be estimated from these thematic maps. For instance, the area under alfalfa production was reduced by about 20% within a growing season due to PRR disease (Fig. 4). Such information can help a grower make informed decisions regarding site-specific fungicide applications to slow down the disease spread or determine when the stand is no longer profitable.
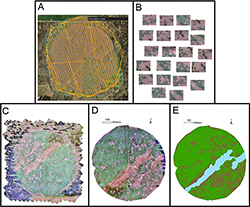 |
Fig. 3. Aerial image processing workflow:
(A) Unmanned aerial vehicle follows along a GPS-
guided flight path; (B) aerial images collected during
flight; (C) individual images stitched to generate an
orthoimage; (D) georeferencing of the orthoimage;
and (E) thematic map generation of the georeferenced
image for estimating area lost due to Phymatotrichopsis
root rot. |
PRR also impacts cotton production to the point where crop loss to this disease in the United States in 2013 totaled up to $68 million (www.cotton.org). Multispectral aerial images collected using a manned aircraft (Cessna 206 single-engine aircraft) on two separate cotton fields over a 10-year interval period were used to compare spatial patterns of PRR disease spread (Yang et al. 2016). The results indicated that a buffer distance of about 3 to 12 m around the infected areas accommodated for PRR disease expansion, thus demonstrating the utility of historical imagery data for generating prescription maps. An interesting follow-up study might combine aerial imagery data with weather data to create models that predict the incidence and severity of PRR at a regional as well as field-specific level.
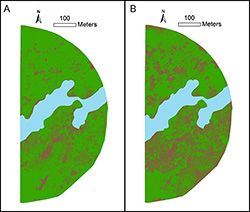 |
Fig. 4. Unsupervised classification of aerial images
of a 21.1-ha alfalfa hay production field infested with
Phymatotrichopsis root rot at the Red River Farm,
Burneyville, OK. Alfalfa stand was established in the
fall of 2011. Images were taken in June (A) and
September (B) of 2015. Green color represents
alfalfa, brown symbolizes soil, and blue is the area
lost due to flooding. |
Future Trends
Regardless of the technological advances, a grower is most interested in how these technologies can be used to make better crop management decisions that would translate to increased returns. A large number of growers are already using GPS-guided machinery for planting and harvesting. Adoption of UAS-based remote sensing and GIS in farming operations is progressing, and one way this can be furthered is by relaxing the rules for operating UAS. Recently, 14 CFR (Title 14 of the Code of Federal Regulation) Part 107 was introduced by the Federal Aviation Administration, which provides guidelines for operating small UAS (unmanned aircraft weighing less than 55 pounds on takeoff) for commercial purposes. This new set of rules might change the way growers raise crops and manage pests, as it provides more flexibility in researchers’ and growers’ use of UAS for continuous monitoring of fields for disease and other production problems.
It is reasonable to presume that the geospatial approaches have to be tailored for each cropping system and associated pests and pathogens. For example, while collecting remote sensing data from an orchard, variables such as tree height, trunk diameter, and canopy diameter are assessed that might not be relevant for row crops. Likewise, appropriate spectral bands for identifying a disease should be determined. For instance, three-band multispectral imagery was combined with unsupervised classification to distinguish PRR-infested areas in a cost-efficient manner (Yang et al. 2010). Differentiating disease patterns with other biotic and abiotic stresses is another factor that merits consideration and therefore appropriate methodologies that are crop-specific and disease-specific need to be investigated.
Considering present trends in the development of advanced UAS and sensor systems, there is no doubt that more agricultural producers and researchers will utilize geospatial tools in agricultural production. The increased potential for incorporating innovative technologies in agriculture is already being witnessed by a spur in the growth of startup companies that are engaged in developing farm management software, drone and sensor technologies, and predictive data analytics. Such advances will result in a massive explosion of spectral and geospatial data, or big data, which demands huge computing power. Today, there are plenty of imagery providers, which provide temperature, vegetation indices, and true color imagery; however, processing massive data and delivering this information in a timely fashion and in a way that a grower can minimize crop inputs and maximize yields will be the real challenge. Hence, we foresee plant pathologists initiating more transdisciplinary collaborations with agricultural engineers, soil and geospatial information scientists, agronomists, aerobiologists, and geostatisticians to standardize protocols for processing and interpreting terabytes of quality geospatial data, and coupling the processed data with weather variables to build models for better disease prediction.
Aerial imagery is valuable, but before a grower can completely rely on this information, ground validation of imagery data is required. Availability of the latest GPS units and GIS software will help to map plant and soil sample collection sites accurately. Such rigorous sampling will involve an additional cost to a grower, but the data generated will assist in the development of disease maps, which will offset sampling expenses. Similar to a road map that helps us navigate to different places, this map-based approach will enable growers to precisely locate disease-prone areas in the field. Developing disease maps in conjunction with yield, nutrient, weed, and other pest maps will give a comprehensive picture of the entire field that a grower can rely upon for executing management decisions that are timely, eco-friendly, and economical.
Presently we are shifting our focus from an individual component to systems-level approaches for solving crop production issues. We therefore envision the geospatial tools discussed here providing researchers with a different perspective for understanding complex interactions among biotic and abiotic factors affecting crop growth and survival. In the growers’ outlook, development of user-friendly remote-sensing platforms and GPS-guided machinery will enhance crop monitoring and management, which would allow precise application of inputs thereby increasing economic returns and crop yields.
Literature Cited
Barasona, J. A., Mulermo-Pázmány, M., Acevedo, P., Negro, J. J., Torres, M. J., Gortázar, C., and Vicente, J. 2014. Unmanned aircraft systems for studying spatial abundance of ungulates: Relevance to spatial epidemiology. PLoS ONE 9:1-17.
Eninger, R. M., and Johnson, R. L. 2015. Unmanned aerial systems in occupational hygiene: Learning from allied disciplines. Ann. Occup. Hyg. 59:949-958.
Fornace, K. M., Drakeley, C. J., William, T., Espino, F., and Cox, J. 2014. Mapping infectious disease landscapes: Unmanned aerial vehicles and epidemiology. Trends Parasitol. 30:514-519.
Gottwald, T. R., and Tedders, W. L. 1985. A spore trap for use on aerial remotely piloted vehicles. Phytopathology 75:801-807.
Harris, J. L., Di Bello, P. L., Lear, M., and Balci, Y. 2014. Bacterial leaf scorch in the District of Columbia: Distribution, host range, and presence of Xylella fastidiosa among urban trees. Plant Dis. 98:1611-1618.
Hijmans, R. J., Forbes, G. A., and Walker, T. S. 2000. Estimating the global severity of potato late blight with GIS-linked disease forecast models. Plant Pathol. 49:697-705.
Jenkins, D., and Vasigh, B. 2013. The economic impact of unmanned aircraft systems integration in the United States. Assoc. for Unmanned Vehicle Syst. Int., Arlington, VA.
http://www.auvsi.org/auvsiresources/economicreport
Li, B., Cao, X., Chen, L., Zhou, Y., Duan, X., Luo, Y., Fitt, B. D. L., Xu, X., Song, Y., Wang, B., and Cao, S. 2013. Application of geographic information systems to identify the oversummering regions of Blumeria graminis f. sp. tritici in China. Plant Dis. 97:1168-1174.
Lyda, S. D. 1978. Ecology of Phymatotrichum omnivorum. Annu. Rev. Phytopathol. 16:193-209.
Mahlein, A.-K. 2016. Plant disease detection by imaging sensors: Parallels and specific demands for precision agriculture and plant phenotyping. Plant Dis. 100:241-251.
Mirik, M., Jones, D. C., Price, J. A., Workneh, F., Ansley, R. J., and Rush, C. M. 2011. Satellite remote sensing of wheat infected by Wheat streak mosaic virus. Plant Dis. 95:4-12.
Nutter, F. W., Jr., Guan, J., Gotlieb, A. R., Rhodes, L. H., Grau, C. R., and Sulc, R. M. 2002. Quantifying alfalfa yield losses caused by foliar diseases in Iowa, Ohio, Wisconsin, and Vermont. Plant Dis. 86:269-277.
Pittman, J. J., Arnall, D. B., Interrante, S. M., Wang, N., Raun, W. R., and Butler, T. J. 2016. Bermudagrass, wheat, and tall fescue crude protein forage estimation using mobile-platform, active-spectral and canopy-height data. Crop Sci. 56:870-881.
Schmale, D. G., and Ross, S. D. 2015. Highways in the sky: Scales of atmospheric transport of plant pathogens. Annu. Rev. Phytopathol. 53:591-611.
Stafford, J. V. 2000. Implementing precision agriculture in the 21st century. J. Agric. Engng. Res. 76:267-275.
Steddom, K., Jones, D., and Rush, C. 2005. A picture is worth a thousand words. APS Features doi:10.1094/APSnetFeature-2005-0405.
Simko, I., Jimenez-Berni, J. A., and Sirault, X. A. A. 2017. Phenomic approaches and tools for phytopathologists. Phytopathology 107:6-17.
Streets, R. B., and Bloss, H. E. 1973. Phymatotrichum root rot. Am. Phytopathol. Soc. Monogr. 8:1-38.
Tallapragada, P., Ross, S. D., and Schmale, D. G. 2011. Lagrangian coherent structures are associated with fluctuations in airborne microbial populations. Chaos 21:033122.
Taubenhaus, J. J., Ezekiel, W. N., and Neblette, C. B. 1929. Airplane photography in the study of cotton root rot. Phytopathology 19:1025-1029.
Taubenhaus, J. J., and Ezekiel, W. N. 1936. A rating of plants with reference to their relative resistance or susceptibility to Phymatotrichum root rot. Tex. Agric. Exp. Stn. Bull. 527:1-52.
Techy, L., Schmale, D. G., and Woolsey, C. A. 2010. Coordinated aerobiological sampling of a plant pathogen in the lower atmosphere using two autonomous unmanned aerial vehicles. J. Field Robot. 27:335-343.
Uppalapati, S. R., Young, C. A., Marek, S. M., and Mysore, K. S. 2010. Phymatotrichum (cotton) root rot caused by Phymatotrichopsis omnivora: Retrospects and prospects. Mol. Plant Pathol. 11:325-334.
USGS. 2016a. Landsat—Earth observation satellites (ver. 1.1, August 2016). Fact Sheet 2015–3081, U.S. Geological Survey (USGS), Washington, DC.
http://dx.doi.org/10.3133/fs20153081
USGS. 2016b. Landsat plays a key role in reducing hunger on Earth. Fact Sheet 2016–3059, U.S. Geological Survey (USGS), Washington, DC. http://dx.doi.org/10.3133/fs20163059.
Yang, C., Everitt, J. H., and Fernandez, C. J. 2010. Comparison of airborne multispectral and hyperspectral imagery for mapping cotton root rot. Biosystems Eng. 107:131-139.
Yang, C., Odvody, G. N., Thomasson, J. A., Isakeit, T., and Nichols, R. L. 2016. Change detection of cotton root rot infection over 10-year intervals using airborne multispectral imagery. Comput. Electron. Agric. 123:154-162.
Zhang, C., and Kovacs, J. M. 2012. The application of small unmanned aerial systems for precision agriculture: a review. Precis. Agric. 13:693-712.

