
Remote sensing is a concept that appears periodically in plant pathology. Often thought of as a new field, remote sensing has, in fact, been used in plant pathology for a long time. In its most basic sense, remote sensing is the practice of gathering information about something without touching it. Many remote sensing applications measure some form of electromagnetic radiation, such as heat or light. Frequently, imagery is captured from aircraft or satellites, but there are also ground-based applications. Both high altitude and ground-based uses of these fields allow greater precision and accuracy for disease assessment and quantification.
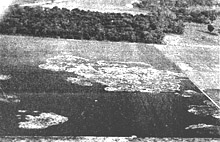
Photographic images of diseased plants could be argued to be remote sensing, but images of a whole field, taken from directly overhead, enable quantitative measurements to be made. The first use of aerial photography in plant pathology appears to have occurred in the late 1920s at the Texas Agricultural Experiment Station in College Station, Texas. Army pilots stopping in College Station reported that cotton root rot spots were readily visible from the air at high altitudes (8) (Fig. 1). C. B. Neblette photographed these spots at altitudes varying between 250 and 500 ft by hanging a camera over the side of the aircraft. The stark contrast between healthy cotton plants and the bare soil where Phymatotrichum had killed the plants makes the spots stand out in the photographs and the vertical angle allows for comparative measures of healthy and diseased acreage. Had the actual sizes of some of the necrotic patches been known, these could have been used to determine the scale of the image, and the exact acreage impacted could have been calculated. This type of approach is much more accurate in determining disease incidence than ground-based surveys for diseases that cause large necrotic areas.
| |
 |
|
| |
 |
|
 |
|
| |
 |
|
| |
Fig. 1. Aerial images of cotton fields infested with Cotton Root Rot from approximately 1927. |
|
| |
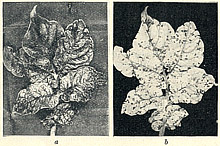
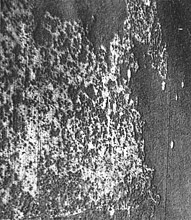
Fig. 2. A potato leaf on panchromatic film (left) and infrared film (right). The lesions appear as small dark flecks that will later enlarge to large areas. |
The use of light beyond the visible portion of the spectrum can enable detection of disease symptoms before they are visible to the eye. F. C. Bawden noted in 1933 that infrared film could capture some virus symptoms, while other symptoms were more readily distinguished on panchromatic film (black and white film sensitive to visible light) (Fig. 2). This was due to the spectral characteristics of the virus symptoms. Chlorophyll absorbs light in the blue and red regions, resulting in the green appearance of leaves. Just past the visible portion of the spectrum, in the near infrared, leaves reflect nearly 50% of the infrared light (Fig. 3). This reflectance is due to refraction of light at the large number of interfaces between air and cell walls in the spongy mesophyll. This rapid increase in reflection from the red to the near infrared is characteristic of vegetation and termed the “red-edge.” Necrotic or water-soaked tissue does not exhibit the strong reflection of infrared light and appears dark with infrared film. Chlorotic tissue lacks chlorophyll and appears bright on panchromatic film, but cannot be distinguished from healthy tissue on infrared film. Bawden noted that the infrared film was so sensitive that necrosis was plainly visible on film when it was barely visible to the eye. Chaerle, et al. (3), showed the same effect with thermal imaging in 1999. In 1956, Colwell (4) used the spectral properties of healthy and diseased cereal crops to predict the correct film and filter combinations that would be required to image disease at the plot and field scales. His efforts were aided by the availability of color film and color infrared film. He studied both rusts and Barley yellow dwarf virus on wheat, oats, and barley. Estimates of rust severity using aerial photographs were within 10% of those same estimates made on the ground. Colwell’s work was so thorough and recorded in such detail that it is still a common method today. Many remote sensing scientists consider his work to be a milestone in their field.
| |
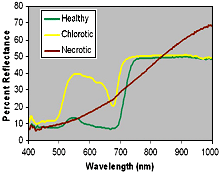
Fig. 3. Leaf spectra of some common plant disease symptoms. |
|
Absorption of light by plant pigments and reflection from leaf structures all overlap in the visible regions of the spectrum. In addition, atmospheric distortions and physical artifacts tend to affect different parts of the spectra differently (Fig. 4). Vegetative indices were developed to alleviate these difficulties. The first vegetative indices were ratios of one area of the spectrum against another. With the original satellite images, these were known as band ratios. One of the most common vegetative indices is the NDVI. This stands for the Normalized Difference Vegetative Index, but its use has been so frequent that some papers will refer to it simply as NDVI. This index is the difference between the reflectance in the near infrared and red regions of the spectrum divided by the sum of these two values. Turgid leaves with a large amount of spongy mesophyll will have a high reflectance in the near infrared, while the absorption of red light by chlorophyll will result in very low reflectance in the red region. Simply subtracting these two values from each other will result in a very useful value; however this is affected by the degree of shadowing. Division by the sum of these two values normalizes the data and minimizes the affect of shadowing. Shadowing is not a trivial factor. Anyone who has admired the alternating stripes of freshly mowed grass has witnessed the affect of shadowing on reflectance. When the mower pushes the blades of grass toward the viewer, the grass will appear darker since you will see more of the shadowed portion of the leaves. When the grass is pointed away from the viewer the grass will be lighter, since you are viewing a greater percentage of the sun-lit portion of the leaf. Mowing in an alternating pattern results in strips of grass either pushed toward the viewer or away. As data sources have increased in resolution, these indices were modified to more accurately quantify a particular parameter, and new ones were developed. Some are designed to quantify a particular pigment using very specific wavelengths. Consequently it is common practice to define the exact wavelength for the vegetative index.
| |
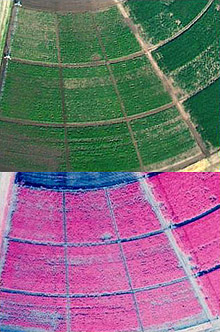
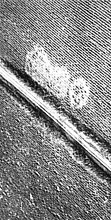
Fig. 4. Color infrared (bottom) and true color (top) aerial photographs of a sugar beet variety trial. The effects of varietal susceptibility to Rhizoctonia root rot and different watering regimes can be seen in these photos. The color infrared image is more sensitive at low plant populations than the true color image. |
|
Machine vision is an area of research that has come out of industrial engineering but is merging with remote sensing and finding use in agriculture. In machine vision, a computer analyzes an image and measures parameters within it. A simple application in agriculture is measuring percent leaf area by dividing the number of green pixels by the total number of pixels within the image. This can be extrapolated to classifying pixels as either leaf, lesion, or other, measuring foliar diseases as APS Assess does. This approach is being investigated for targeted disease control (9). There is also work on applying this approach to within-row mechanical weed control (1).
The space race of the1960s brought us a rapid increase in the number of satellites orbiting the earth. A great deal of research went into military surveillance technologies. As these technologies were declassified, they enabled the development of land observation satellites. Landsat 1 was launched in 1972, providing systematic and repetitive observations of the earth’s surface with sensors covering multiple regions of the electromagnetic spectrum. Several more Landsat satellites (Fig. 5) were launched over the years, each with higher resolutions, followed by commercial systems such as Ikonos and SPOT. Satellite images do not appear to have been used in many plant pathology studies. Most plant pathologists want high-resolution images that monitor a disease epidemic as it progresses. Problems we have had with these systems are low-resolution images, cloud cover, and infrequent timing. However, one of the nice features of the Landsat systems is that the data is collected over most of the world and archived for future study. Fritz and Pennypacker (5) were able to use satellite data to detect large areas of forest that had been affected by zinc toxicity. Nagarajan, et al. (6) used imagery from the Landsat 2 satellite to monitor a wheat rust epidemic in Pakistan. Their work predated the advent of the personal computer, and showed that even the relatively low resolution provided by these early satellites could be used to monitor large-scale disease events.
| |
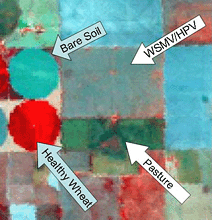
Fig. 5. A Landsat 5 image showing fields of (clockwise from lower left) healthy wheat, bare soil, wheat infested with wheat streak mosaic virus and high plains virus, and pasture. The band selection for this image was band 4 (780 to 900 nm) for red, band 3 (630 to 690 nm) for green, and band 2 (520 to 560 nm) for blue.
|
|
As computer prices have dropped and the speed and quality of computers has increased, the world has relied more heavily on digital information. This is also true for remote sensing. Most scientists now own a computer that is powerful enough for complex analysis of large digital images. The imaging systems used to gather remote sensing data have also dropped in price and increased in quality. Image resolution has increased over the years making it more likely that a diseased area of a field will be detected in an image. The spectral resolution of systems also has improved. Early satellite systems collected light in a few large bandwidths due to the limited sensitivity of the sensors available at that time. Sensor sensitivity has increased to allow the detection of light in narrower wavelengths. It is now possible to generate images where each pixel contains a spectrum (Fig. 6). These images are known as hyper-spectral images, and combine the features of a spectrometer with the spatial information of an image. They are likely to improve our ability to differentiate between healthy and diseased crops and between different diseases. Redlake's website provides examples of multispectral images of diseased fruit and plants (7).
| |
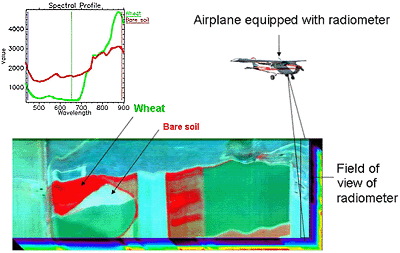
Fig. 6. Each pixel within a hyperspectral image consists of an entire spectrum. Healthy and diseases crops can be identified based upon their spectral properties. |
|
Past research with spectra have resulted in a commercial hooded sprayer system that only applies a herbicide to a furrow when a weed is detected. This reduces the amount of herbicide that is applied, reducing costs and environmental impact. Another application is a system that can vary the application rate of nitrogen based on the "greenness" of the crop canopy. Current research into remote sensing and machine vision will become the commercial applications of the future.
Additional Resources
PrecisionAg
Agricultural Remote Sensing Basics
North Dakota State University Extension Service
Introduction to Remote Sensing for Agriculture
U.S. Water Conservation Laboratory
Journal of Precision Agriculture
Vision-Guided Mechanical Weed-Control
Multispectral Imaging in Food and Agriculture
Literature Cited
1. Åstrand, B. 2004. Vision-guided mechanical weed control. Online. School of Information Science, Computer and Electrical Engineering, Högskolan i Halmstad, Sweden.
2. Bawden, F. C. 1933. Infra-red photography and plant virus diseases. Nature (Lond.) 132:168.
3. Chaerle, L., Van Caeneghem, W. M., Eric, Lambers, H., Van Montagu, M., and Van Der Straeten, D. 1999. Presymptomatic visualization of plant-virus interactions by thermography. Nature Biotechnol. 17:813-816.
4. Colwell, R. N. 1956. Determining the prevalence of certain cereal crop diseases by means of aerial photography. Hilgardia 26:223-286.
5. Fritz, E. L., and Pennypacker, S. P. 1975. Attempts to use satellite data to detect vegetative damage and alteration caused by air and soil pollutants. Phytopathology 65:1056-1060.
6. Nagarajan, S., Seibold, G., Kranz, J., Saari, E. E., and Joshi, L. M. 1984. Monitoring wheat rust epidemics with the Landsat-2 satellite. Phytopathology 74:585-587.
7.Redlake. 2005. Multispectral imaging in food and agriculture. Online. Multi-spectral cameras, technical articles. Redlake, San Diego, Calif.
8. Taubenhaus, J. J., Ezekiel, W. N., and Neblette, C. B. 1929. Airplane photography in the study of cotton root rot. Phytopathology 19:1025-1029.
9. West, J. S., Bravo, C., Oberti, R., Lemaire, D., Moshou, D., and McCartney, H. A. 2003. The potential of optical canopy measurement for targeted control of field crop diseases. Annu. Rev. Phytopathol. 41:593-614.

