Peer-Reviewed by Plant Health Progress
Tim R. Gottwald
USDA Agricultural Research Service
Ft. Pierce, FL 34945
Michael Irey
US Sugar Corporation
Clewiston, FL 33440
(Corresponding author: Tim.Gottwald@ars.usda.gov)
Gottwald, T. R., and Irey, M. 2007. Post-hurricane analysis of citrus canker II: Predictive model estimation of disease spread and area potentially impacted by various eradication protocols following catastrophic weather events. Online. Plant Health Progress doi:10.1094/PHP-2007-0405-01-RS.
2007. Plant Management Network. This article is in the public domain.
Accepted for publication 23 January 2007. Published 5 April 2007.
Abstract
The impact of 2005 Hurricane Wilma on the dissemination of Xanthomonas axonopodis pv. citri (Xac), the cause of Asiatic citrus canker (ACC), and subsequent disease development was examined and predictions for the areas into which Xac was likely to have spread from known sources of infection were developed. In addition, the effect of the current 579-m (1900-ft) ACC eradication protocol, resulting in removal of all "exposed trees" with a 579-m radius of a known Xac-infected tree, was calculated via GIS analysis and expressed as the predicted "impacted area." The GIS calculations were based on the extension of the previous published wind-rain index vector (WRIV) model. The model extension consisted of the incorporation of an estimate of distance of spread due to various combinations of wind and rain from data collected during the 2004 hurricane season. An inverse power law dissemination function was used to describe regional dispersal from a point focus of Xac infection. Alternative eradication protocol (distances) to the 579-m protocol were evaluated in association with the GIS analyses and used to examine the effect of eradication distance on predicted "impacted area." The results of these analyses were used by state and federal regulatory agencies and commercial citrus producer groups to evaluate the feasibility of continued ACC eradication.
Introduction
Hurricanes and tropical storms have been associated with long-range dissemination and local increase of the bacterium Xanthomonas axonopodis pv. citri (Xac), which causes Asiatic citrus canker (ACC) in Florida (4,10,11,21). When combined with pre-storm introductions to new areas and post-storm spread of bacterial inoculum, disease increase can be rapid and overwhelming to commercial plantations. In 2004, three hurricanes (Charley, Frances, and Jeanne) and one tropical storm (Ivan) (7,24) crossed the Florida peninsula and exacerbated preexisting ACC infections and dispersed the pathogen over a wide area (21). This resulted in the establishment of numerous new infections at substantial distances from the known pre-existing infections. It also stimulated intensified survey efforts to detect new foci of infection and the subsequent eradication efforts on the part of the Florida Department of Agriculture and Consumer Services (FDACS) and USDA-APHIS to eliminate the new outbreaks. Of great concern to the commercial citrus industry and to the regulatory agencies was the determination by National Oceanic and Atmospheric Administration (NOAA) that the annual occurrence of hurricanes and tropical storms has been escalating since 1995 and that the US was experiencing an anticipated 30-year period of increased Atlantic and Gulf hurricane activity (23,26). Therefore, the leaders of the joint state and federal Citrus Canker Eradication Program (CCEP) desired to detect and eliminate all citrus canker infections in the state prior to additional hurricanes striking Florida and reducing the likelihood that eradication could succeed.
In an effort to rapidly detect new post-2004 hurricane infections of ACC, a series of survey protocols were used simultaneously. A "sentinel grove survey" was devised which was based on intensive sampling of selected "sentinel" commercial blocks of susceptible cultivars, each between 20 and 50 acres in size, within each square mile of Florida that contained commercial citrus. This sentinel survey was repeated every 60 to 90 days. A "targeted grove survey" was implemented based on meteorological weather data that used a GIS-weather model to predict direction of spread due to hurricanes to target manpower and resources into areas most likely to have become infected due to hurricane assisted spread (21). This same survey method could be used to backtrack from new infections to most probable areas to search for older infection sources. When new infections were discovered a third type of survey, a "delimiting grove survey," was immediately deployed consisting of a total census of all citrus within 8 km (5 miles) of each new infection. Often this led to additional discoveries of new or pre-existing infections that would initiate additional 8-km (5-mi) radius delimiting surveys, etc. The final survey was a grower "self survey" in which production managers, and other workers that daily come in contact with commercial citrus in their duties were trained by a joint University of Florida and FDACS Division of Plant Industry (DPI) program to search for, recognize, and report suspicious symptoms to FDACS-DPI or USDA-APHIS inspectors for confirmation (5,6). More new infections were found by deploying this huge manpower resource than any of the other survey methods used previously. All discoveries of citrus canker and exposed trees within 579 m of infected trees were then scheduled for eradication at the earliest possible time as prescribed by Florida law. This resulted in an estimated removal of over 25,779 ha (63,701 acres) of infected and exposed commercial citrus during 2005 following the 2004 hurricane season in an effort to eradicate the disease from commercial plantings (5,6). However, due to the size and complex logistics of this endeavor, some removals lagged behind.
The 2005 Atlantic hurricane season was extremely active with 31 named storms (24). Unfortunately, not all citrus canker infections resulting from the 2004 hurricane season had been removed when Hurricane Wilma struck the Florida peninsula on 24 October 2005. Additionally, new infections were subsequently discovered that predated the passing of Wilma and likely contributed to subsequent spread. The FDACS-DPI and USDA-APHIS leadership requested that we use our prior knowledge of the effect of hurricanes on dissemination and infection of citrus canker to estimate the number of new infection sites and commercial area that would be impacted by continued eradication (impacted area) to determine the feasibility of continuing an eradication program in its present or some modified form. The objectives of this study were: (i) to develop a model to generate a detailed prediction of spread of ACC in commercial citrus from known sources (foci) of infection that existed in Florida at the time Wilma crossed the peninsula, based on prior knowledge and measurements of disease spread over the 14-month period following the 2004 hurricane season; and (ii) to utilize the model to examine possible alternative eradication protocols and their effect on the Florida commercial citrus acreage.
Biological and Physical Factors Affecting Xac Inoculum Production, Dissemination, and Infection
When Xac lesions are wetted, inoculum begins to exude from wetted lesions within 1 to 5 minutes (4,12,28,30). The maximum concentration of bacteria is exuded within the first one- to two-hour period following the beginning of the rain, although inoculum will be produced continuously at a lower concentration for the duration of the storm. (4,21). Xac can be dispersed in gentle rain, rain with wind, rain storms, tropical storms, and hurricanes and these meteorological events are progressively more effective at dispersing inoculum over greater distances. In addition, inoculum can be dispersed mechanically from within trees to very long-distance through human activities, including the movement of infected plant material over short distances (local) to long range (global = among countries and continents), and routine horticultural tree care such as mowing, pruning, hedging, harvesting, spraying, etc. (9,12,15,17,28). However, these meteorological and human dispersal events are not continuous and vary greatly in distance and quantity of inoculum dispersed. Thus, from an epidemiological point of view, epidemics of ACC are composed of a series of discontinuous pulses of inoculum that first introduce Xac to the host population, with a combination of multiple meteorological and mechanical events that further disperse inoculum and exacerbate the epidemic.
A critical addition to the ACC pathosystem was the introduction of the Asian citrus leafminer (Phyllocnistis citrella Stainton) in 1993 (18,19,20). At this time, the leafminer is endemic, abundant, and distributed throughout all commercial areas of Florida. Following the introduction of this insect, ACC infection increased severely as a consequence of the insect’s feeding activities which create wounds that expose susceptible leaf mesophyll tissues to splashed inoculum, thus increasing the probability of infection by Xac. Foliar wounds on citrus leaves normally callus within 1 to 2 days, whereas leafminer induced wounds resist callus formation for about 14 days, allowing the highly susceptible mesophyll tissues to be exposed for a much longer time (1,16). Xac infection commonly occurs when bacteria are driven through the stomata as bacteria-laden rain droplets are combined with wind speeds > 8.0 m/s (17.9 mi/h), and into the substomatal chambers where they begin to multiply (10,11,12,29). However, when leafminer wounds are prevalent, inoculum-laden rain coming to rest on a leafminer gallery can pass through the damaged and cracked cuticle and comes into direct contact with the highly susceptible, exposed, and non-callused mesophyll cells. In addition, leafminer larvae can come in contact with the inoculum and spread it throughout the feeding gallery resulting in hundreds of infections per gallery and many fold greater than stomatal infections. Rain combined with gentle to hurricane velocity winds can carry inoculum long distances that can be deposited on foliar surfaces and penetrate the plethora of leafminer galleries resulting in many fold more infections per meteorological event. When this is combined with the vastly increased, leafminer-induced inoculum generation, the rate of disease increase rises sharply. Additionally there is an indirect effect on spatial patterns of ACC related to the numerous highly susceptible infection courts resulting from leafminer wounds that remain susceptible to infection for prolonged periods (2,3). During rain, inoculum oozes from lesions, is splashed and incorporated into drops and droplets of varying size. Smaller droplets especially can be picked up in air currents and moved considerable distances (4,10,12,21,26). In the absence of leafminer wounds, the vast majority of this inoculum that falls on the surface of citrus tissues and would not penetrate the cuticle. However, when the leafminer is present, the inoculum concentration is much higher and bacteria-laden droplets landing on the prodigious leafminer galleries (wounds) can result in numerous infections. Thus, even gentle storms can result in many fold more infections over the entire bacterial inoculum dispersal range without the need for water congestion for infection. Even though inoculum may be very sparse at the tail end of the dispersal gradient, infection is more probable than when the leaf miner is not present (3). We see this demonstrated in the initial patterns of citrus canker in orchards with very low disease incidence as a nearly random distribution pattern of disease. This extensive bacterial dispersal and infection gradient is well described by the inverse power law dispersal model (3).
Thus the presence of the leafminer facilitates Xac inoculum production, dissemination, and the infection process. The post-leafminer-introduction change in Xac-pathosystem dynamics is one of the main biological factors that resulted in the adoption of the "1900-ft law" in Florida that modified the eradication protocol by requiring removal of all trees within 579 m (1900 ft) of known Xac-infected trees in an attempt to remove the majority (95 to 99%) of the exposed and sub-clinically diseased trees (13,14).
Review of the Wind-Rain Index Vector Model for Estimation of Citrus Canker Spread Via Hurricanes
In a prior publication we presented the development and application of a wind-rain index vector (WRIV) model for citrus canker spread as a result of catastrophic meteorological events such as hurricanes and tropical storms (21). The model used geospatially referenced ACC infection data from infections that were discovered after the 2004 hurricanes. Data resulted from the four types of disease detection surveys conducted as part of the ACC eradication program described above. These surveys were conducted jointly by FDACS, which was responsible for general surveys in commercial groves and residential properties, and by USDA-APHIS which was responsible for sentinel surveys in both residential and commercial citrus groves. The data were examined in relation to wind and rain conditions experienced during the hurricanes and used to develop a predictive model to explain storm-related spread of citrus canker. The model incorporates a "threshold" concept for wind and rain that, in effect, incorporates only biologically significant weather parameters. That is, the wind and rain parameters must exceed minimum thresholds, below which dissemination does not occur. When applied to three distinct areas of the state [see Fig. 3 in Irey (21)], the predictive model was able to account for approximately 80% of the hurricane-related spread and subsequent secondary spread of citrus canker over the succeeding 14 months
Data for the model consisted of spatially referenced GPS data points from both residential and commercial ACC discoveries from three areas in Florida impacted by hurricanes and subsequent ACC spread. The data were entered into a geographic information system (GIS) database along with point specific associated wind and rain data collected from automated weather stations located in close proximity to the three study areas where ACC was detected during the post storm surveys. Hourly rainfall, wind speed, and wind direction weather data used were collected that spanned the time period of the hurricanes.
The model calculates wind-rain index vectors (WRIV) based on the concept of a "wind rose" analysis [see Fig. 4 in Irey (21)]. A wind-rain index (Iwr) using predetermined thresholds was calculated preticated on the assumption that both wind (w) and rain (r) must occur at the same time in order for Xac to be dispersed further than a few meters.
The model takes the form:
| Iwr = |
( |
w r |
) |
[1] |
| wmax rmax |
where, wmax = 33.5 m/s (75 mph), rmax= 5.08 cm/hr (2.0 in/hr), and thresholds of w ≥ 8 m/s (17.9 mph) (See Irey, (21) Fig. 7). and r ≥ 0.318 cm/hr (0.125 in/hr) [see Fig. 8 in Irey (21)]. The model was used to calculate vectors in 15-degree wind direction increments in a "blowing to" orientation and the relative potential to spread is indicated by the numerical index of the Iwr (represented by a color scale), and the relative duration of conditions favorable for spread is represented by the length of the "blowing to" vector [see Fig. 5 in Irey (21)]. The length of the calculated vectors was set at 56.3km (35 miles) based on the maximum distance of hurricane-induced spread of Xac wind and rain measured (21). The WRIV for individual w and r threshold combinations in the wind rose plots were overlaid on the infection data in the GIS plots using the foci of infection in each study area as the origin for the WRIV [see Fig. 7 in Irey (21)]. The predictive model accounted for approximately 80% of the hurricane-related and subsequent secondary spread of ACC over the 14-month post-hurricane period. However, it is probable that some of the secondary spread events could have transported inoculum and established new infections beyond the bounds of the vectors predicted by meteorological conditions and associated with only the main meteorological event, i.e., the hurricane(s). Thus the models would under predict dispersal somewhat.
The WRIV model was used as a tool to predict the spread of citrus canker from known sources to target survey efforts to find new previously undiscovered infections as well as a tool to backtrack over a potential dispersal gradient, toward the pre-hurricane inoculum source. This methodology was used repeatedly to identify unknown pre-hurricane foci of infection and to subsequently further delimit the areas that should be surveyed. The resulting "targeting" of CCEP survey efforts was of considerable benefit to greatly reduces the survey effort to the most critical survey search area, providing a higher probability of finding both new and older but previously unknown infections, making more efficient use of CCEP personnel and fiscal resources (21).
Extension of the Wind-Rain Index Vector Model
The model from Irey (21) described above utilized a standard dispersal distance of 56.5 km, the maximum distance of dispersal recorded, during all prior measurements of ACC spread. This was taken as a worst-case scenario and is used to direct survey efforts, primarily downwind from known infections. The long distance was used as a safeguard to ensure the maximum number of detections. However, to predict the impacted area (number of acres) of commercial citrus that would potentially be affected by a severe storm event and subsequently subjected to eradication, the distance of dispersal must also be taken into account. The distance of dispersal is a function of the interaction of w and r from Equation 1. Data from the Orange County, Lee/Charlotte County, and Indian River/St. Lucie/Martin County (Treasure Coast) study areas and dispersal measured subsequent to hurricanes Francis, Jeanne, and Charlie as previous described, were reexamined (7,21). Each 15-degree vector was correlated with dispersal from known sources of infection that predated the hurricanes. A power law function was fitted to the cumulative wind-rain index (during a 1-h period) for each 15-degree vector (∑Iwr) versus dispersal distance for those vectors via regression analysis (Fig. 1, Equation 2):
y = 9.7551 (Iwr)0.2893 [2]
where y is the length of the dispersal gradient, estimated by the equation. The resulting power law model well represented the data (R² = 0.967) over a broad range of Iwr and provided a predictor of distance of dispersal as a function of the interaction of w and r.
| |
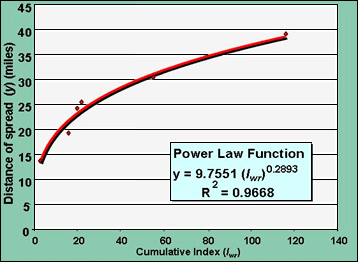
Fig. 1. Power law function of distance of dispersal of Xac during hurricane force winds as a function of cumulative index Iwr, representing the interaction of maximum wind speed and rain fall during a 1-h period. |
|
In addition to the actual wind and rain data measured, the physical effects of a hurricane on both the inoculum source and the target host must also be taken into account in describing the effects of severe weather on inoculum dispersal and subsequent spread. Hurricane winds are extremely damaging. Fruit and foliage are torn from trees, remaining foliage is frequently shredded and damaged, limbs can be torn off of trees, and in extreme cases, trees uprooted and occasionally blown some distance (Fig. 2). The longer a tree is subjected to hurricane velocity winds, the greater the potential damage. Hurricanes can traverse plantings at various speeds and thus subject orchards to damaging winds for varying durations of time. Inoculum is exuded from Xac lesions within a few minutes of wetting and maximum exudation occurs within the first one to two hours (4). Hurricane winds are also cyclonic and change direction as the storm passes over a given point. Wind speed increases from the outer extents of the storm toward the center and the strongest winds are associated with the hurricane eye wall. If the hurricane eye passes directly over a point, severe damage can occur due to eye wall winds and wind direction can completely reverse direction from the "front side" of the storm proceeding the eye wall to the "back side" following the eye wall. Thus a hurricane that passes over an orchard over a multiple-hour period, will have a different effect on Xac dispersal at the beginning of the storm versus the end of the storm and depending on how directly the storm strikes the orchard. Lesions will have their high population of Xac bacteria at the onset of the storm and begin dispersing inoculum immediately but as the storm continues inoculum exudation lessens dramatically (4,26). Thus the front side of the storm will be associated with higher inoculum exudation and dispersal and the back side with lower inoculum and dispersal potential. A large amount of foliage is also removed from trees subjected to hurricane velocity winds. Therefore, based on the data of Bock et al. (4), we assumed a back side inoculum production potential from remaining lesions of 25%, that is, a 75% or more reduction. Based on examination of multiple orchards subjected to foliar damage following hurricanes in Florida orchards, we generalized the damage associated with hurricanes as approximately 50% or greater foliar removal and therefore assumed that during the back side of the storm only approximately 50% of the foliage remained. Obviously these reductions in inoculum production and proportion of foliar removal due to hurricanes can vary greatly but to simplify the calculation we assumed an overall index reduction/compensation factor of 0.25 * 0.5 or 0.125, such that:
Iwr (back side of hurricane) = 0.125 Iwr [3].
| |
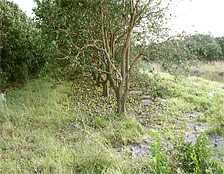
Fig. 2. Citrus tree in south Florida subjected to hurricane force winds. |
|
The extended model incorporating length of dispersal distance was then used to calculate each vector as previous described by Irey et al. (21), and adjusted for inoculum production and host target for front versus back side of the storm. A comparison of the predicted area affected by Xac dispersal using unadjusted versus adjusted dispersal vectors is presented in Fig. 3 using the Indian River/St. Lucie/Martin County (= Treasure Coast) study area as an example.
Fig. 3. WRIV for the Treasure Coast area (A) with individual WRIV extended 56.3 km (35 miles) in each "blowing to" direction, and (B) vectors adjusted to estimated dispersal distance as a function of ∑Iwr.
Calculation of Infected/Impacted Commercial Citrus Areas
The most extensive data set for hurricane-attributed Xac dissemination was from the Treasure Coast commercial citrus area. Prior to October 2005 and the occurrence of Hurricane Wilma, this area consisted of approximately 69,784 ha (172,441 acres) and was used as the basis for calculation of impacted area. To calculate the impacted area, the location of post-hurricane discoveries and the WRIV extended vectors were plotted as overlays onto the map of commercial citrus in the study area using GIS software (ArcMap 9.0, ESRI, Redlands, CA). Approximately 72.5% of the Xac-infected trees fell within the calculated WRIV vectors utilizing the dispersal distance adjustment. The 579-m (1900-ft) eradication protocol, in place and active state law at the time of this study, required that all citrus within 1900 ft of a known Xac-infected tree to be considered exposed and thus subject to removal. Therefore, using GIS software, the 579-m (1900-ft) radii surrounding each infection point were drawn (Fig. 4). The GIS software was then used to calculate the commercial citrus area in acres within the 579-m radii and that also lie within the boundaries of the combined vectors (shown in Fig. 3), i.e., about 72.4% of the area within the 1900-ft radii in the Treasure Coast area also fell within the vectors. Based on this process, 17,471 ha (43,173 acres) were determined to fall within the vectors, and 12,656 ha (31,273 acre) were determined to be commercial citrus acres affected by the 579m radii. The sum of these area calculations revealed that 25.7% of the total Treasure Coast commercial citrus acres that lie within the vectors are also within the 579-m radii of post-hurricane canker discoveries and were therefore subject to removal by eradication. However, this is an underestimate of spread because 27.5% of the Xac-infected trees fell outside of the predicted vectors. This additional area, 4,816 ha (11,901 acre), was estimated as within 579-m radii surrounding Xac-infected trees but fell outside of the predicted vectors. This additional area may represent subsequent secondary spread, etc., that occurred in the 14 months following the 2004 hurricane season, and was added to the total area and was used to adjust the calculation below to estimate the adjusted total "impacted acres."
| |
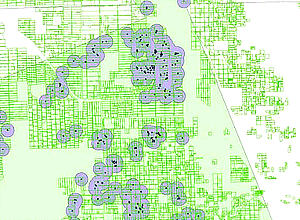
Fig. 4. GIS calculation of impacted acreage. Partial representation (blow up of portion) of the WRIV for the Treasure Coast area. Green outlined areas indicate commercial citrus plantings. Green shaded area indicated Xac dissemination vector calculated by extended WRIV model. Blue dots indicate GPS position of infected trees. Purple areas indicate combined 579-m radii areas surrounding infected trees subject to removal for disease eradication. |
|
GIS Estimation of the Affect of Hurricane Wilma on Xac Dissemination
Hurricane Wilma affected the northern Caribbean islands, especially Haiti and Jamaica, and then Mexico and Florida (25). At the time Hurricane Wilma passed over Florida, backlog inventory of Xac infected and exposed trees awaiting removal existed in the state. Following Hurricane Wilma but prior to symptom development of new hurricane-induced infection, additional Xac infected trees were located. GPS locations of the combined known infections in existence during Hurricane Wilma were utilized as infection source points for calculation of Xac dissemination. Prior to the passing of Hurricane Wilma, the authors had selected the GPS position of 220 locations arrayed across the Florida commercial citrus industry for future use in meteorological based calculation (Fig. 5). Meteorological data from the National Weather Service was interpolated by ZedX Inc. (Boalsburg, PA) for each of the 220 locations and consisted of rainfall and maximum wind speed on an hourly basis. For the duration of Hurricane Wilma, these data were used as w and r variable inputs to parameterize the WRIV model described above. The eye of Hurricane Wilma tracked across the state of Florida from the southwest of the state to the southeast in an east by northeast direction but the width of the storm was such that slightly more than the southern half of the Florida peninsula was affected by the storm to some extent (25) (Fig. 6). Wilma was a fast-moving storm and crossed the peninsula in about 4.5 h from the initial outer wind and rain bands striking the southwest coast to the trailing bands departing the east coast of Florida (24,25). Maximum sustained surface wind speed was 105 kts (54 m/s, 121 mi/h) as the hurricane struck Florida (25) and, based on surface Doppler radar data, most of the southeastern Florida peninsula experienced at least Category 1 hurricane conditions or greater with many locations having Category 2 conditions with wind gusts of near 100 kts (51.5 m/s; 115 mi/hr). Wilma also produced ten tornados over the Florida peninsula on October 23-24, one each in Collier, Hardee, Highlands, Indian River, Okeechobee, and Polk counties and four in Brevard County (25).
| |
 |
|
Fig. 5. Distribution of interpolated weather data locations (blue dots) in relationship to commercial industry (green areas). Red line indicated the track of Hurricane Wilma, 24 October 2005.
|
|
A |
|
B |
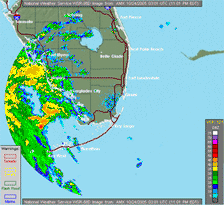
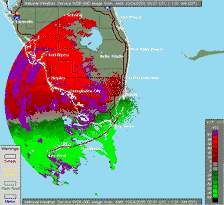
Fig. 6. Hurricane Wilma track across south Florida. National Weather Service Doppler radar animations of (A) rainfall intensity (click to download 3 MB version) and (B) windspeed in knots (click to download 1.3 MB version).
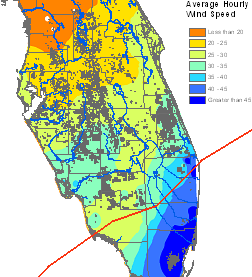
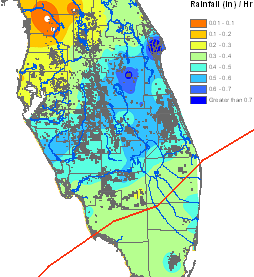
The cumulative hourly wind speed and cumulative hourly rainfall were mapped by kriging (Spatial Analyst, ESRI, Redlands, CA) using the w and r values for the 220 GPS positions (Figs. 7 and 8). The highest wind speed was on the extreme southeast coast of Florida predominately below the track of the eye of the storm (Fig. 7), whereas the highest cumulative rainfall occurred in a band across the peninsula somewhat north of the track (Fig. 8). The WRIV model index Iwr, was calculated for all 220 locations as well and used to generate a map by kriging the index values (Fig. 9). The Iwr values were lower for a number of miles on both sides of the track. This is a consequence of the traverse of the fairly wide hurricane eye, which was devoid of wind and rain for periods of time as the hurricane passed. Thus when the data were calculated as cumulative values using the raw Iwr data, this void of wind and rain greatly affected the cumulative Iwr even though the strongest winds and rains occurred in this area as the hurricane eye wall passed (Fig. 9).
| |
Fig. 7. Cumulative average hourly wind speed (w) values recorded during the traverse of Hurricane Wilma. Map created by kriging values across 220 GPS locations in commercial citrus plantings in Florida. |
|
 |
|
| |
 |
|
Fig. 8. Cumulative average hourly rainfall (r) values recorded during the traverse of Hurricane Wilma. Map created by kriging values across 220 GPS locations in commercial citrus plantings in Florida. |
|
| |
Fig. 9. Cummulative average Iwr values recorded during the traverse of Hurricane Wilma. Map created by kriging values across 220 GPS locations in commercial citrus plantings in Florida. |
|
 |
|
To partially correct for this, data for each weather station along the track of the storm was examined to identify the stations and data during the periods of time where the passing of the eye impacted the data. For the one-hour periods that measured data during the actual passing of the eye walls, the Iwr values from the immediately preceding and succeeding hours were used in the cumulative calculations. Although these are likely to be underestimates of the intensity of the maximum winds that occurred during the passing of the wall because they do not contain the windspeeds of the eye wall itself, they were felt to more accurately reflect the actual conditions than the data that were affected by the lulls during the passing of the eye (Fig. 10).
| |
 |
|
Fig. 10. Highest Iwr values recorded during the traverse of Hurricane Wilma. Map created by kriging values across 220 GPS locations in commercial citrus plantings in Florida. |
|
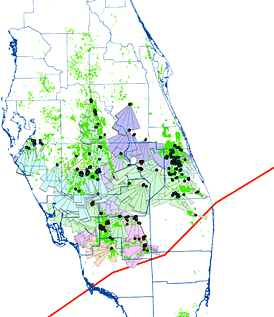
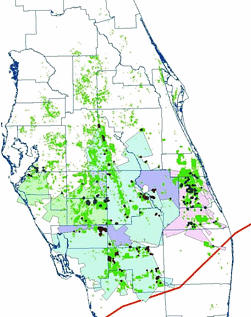
Individual 15-degree vectors were calculated using Iwr and y for each known location of preexisting Xac infection and mapped by GPS software resulting in many overlapping areas of potential inoculum dispersal and infection (Figs. 11 and 12). Note that for prior infections near the hurricane track (within the hurricane eye as it passed), only front-side and back-side vectors were calculated, because no wind and rain occurred within the eye as it passed (Fig. 11, southern-most focus light green), whereas vectors calculated from the northern-most foci of infection represented a more continuous sweep of change in wind direction from westward to southeastward (Fig. 11 northern-most focus and vector areas in purple). Vectors were calculated for each of the five citrus growing regions — Northern, Western, Southern, Central, and Indian River — as described in Irey et al. [see Fig. 1 in Irey (21)], because calculation of all vectors within all areas simultaneously exceeded existing computer and GPS program capabilities. Vector areas within each region were then combined into one non-overlaping area and truncated at the borders of the citrus region (Figs. 13 and 14).
| |
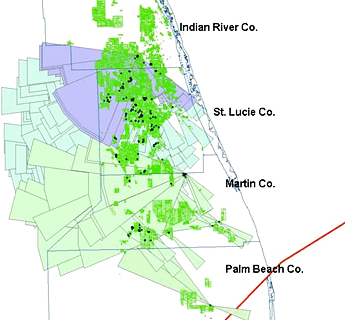
Fig. 11. Indian River (Treasure Coast) commercial citrus area. WRIV model vector areas predicting dispersal of Xac from known existing foci of infection at the time of Hurricane Wilma passing. Red line indicates track of Hurricane Wilma. |
|
| |
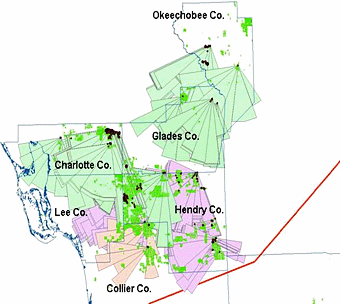
Fig. 12. Southern commercial citrus area. WRIV model vector areas predicting dispersal of Xac from known existing foci of infection at the time of Hurricane Wilma passing. Red line indicates track of Hurricane Wilma. |
|
| |
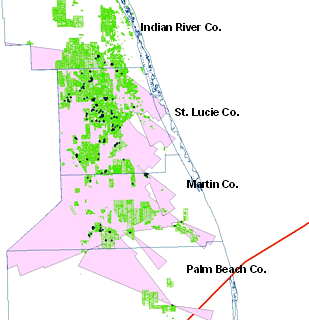
Fig. 13. Indian River commercial citrus area with total predicted non-overlapping WRIV model vector areas truncated to only include those within the Treasure Coast citrus area. |
|
| |
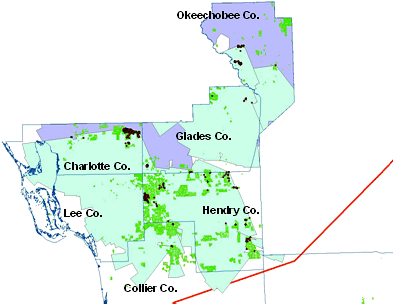
Fig. 14. Southern commercial citrus area with total predicted non-overlapping WRIV model vector areas truncated to only include those within the Southeast citrus area. |
|
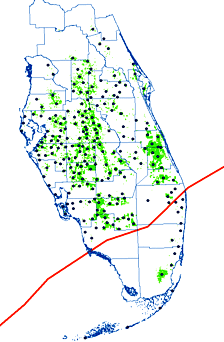
The total areas of all five regions were then combined to form one overarching map for the state of Florida depicting existing Xac foci of infection at the time of Hurricane Wilma, and post Wilma predictions of the potential area that would be impacted by Xac dissemination and spread over the next 14 months after the hurricane passed, based on prior knowledge of hurricane-induced dissemination and distance as described above (Fig. 15).
| |
 |
|
Fig. 15. The total areas of all five commercial citrus regions combined to form one overarching map for the state of Florida depicting existing Xac foci of infection at the time of Hurricane Wilma (blue dots), and post Wilma predictions of the potential area that would be impacted by Xac dissemination and spread over the next 14 months after the hurricane passed. Red line indicates track of the center of the eye of the hurricane.
|
|
At the time of the passing of Hurricane Wilma, based on data from the Florida Agricultural Statistical Service and FDACS-DPI database inventories, we estimated that approximately 261,758 ha (646,819 acre) of commercial citrus existed in the state of Florida following the over nine years of CCEP removals in attempts to eradicate ACC. The total estimated combined area under the Xac dispersal vectors calculated statewide was 193,562 ha (478,302 acre) (Fig. 15). Prior to Wilma, the Treasure Coast commercial citrus area consisted of 69,784 ha (172,441 acres), for which the most extensive hurricane spread data exist, we assumed that the potentially impacted area would develop numerous new disease foci and estimated that approximately 25.7% of that area 12,656 ha (31,273 acre) would be subjected to eradication assuming a 579-m removal protocol as described above. When extrapolated across the total commercial citrus area of Florida, this results in an estimated statewide commercial citrus impacted area of 49,745 ha (122,924 acre) that would be subjected to CCEP eradication protocol and thus removed from the Florida commercial citrus inventory. However, as describe above, this estimate is extrapolated from the Treasure Coast commercial citrus area, for which the most extensive data exist, but is an underestimate because it only accounts for 72% of the actual Xac-infected trees that were accounted for by the predicted vectors. If we account for this underestimate, then an additional 18,930 ha (46,777 acre) would be estimated to fall outside of the predicted statewide vector area, but within commercial citrus plantings and within 579-m radii of Xac-infected trees. Thus the adjusted estimated statewide impacted area would be 68,676 ha (169,701 acre). These calculations incorporate multiple assumptions, each subject to error and thus the resultant predicted impacted area should not considered absolute but only as an estimate with some implied error that could be quite large.
Empirical Estimation of the Effect of Hurricane Wilma on Xac Dissemination
As a validation of the calculation above, an alternative method was used to estimate the area that would likely be affected by Xac dissemination and subsequent infection. In this case, an inverse power law (IPL) dispersal model was fitted to the data from the Treasure Coast commercial citrus area by regression analysis,
Y = a * S-b [4]
where Y is the proportion of the infected population of trees, S is distance in meters from the source of inoculum to the extents of the dispersal gradient, and a and b are constants of integration (Fig. 16A). The resulting IPL dispersal function was used to estimate the cumulative proportion of the population circumscribed as a function of distance for a hurricane event (Fig. 16B). The IPL dispersal function was then used to simulate a hurricane dispersal event in the Treasure Coast Area in 1-km-wide annuli from a known source of infection (Fig. 17A). For this simulation a 30-degree angle of dispersal was assumed, which is the equivalent of two 15-degree vectors of the GIS method described above, and a maximum dispersal distance assumed was equivalent to the maximum distance recorded for the Treasure Coast area from a known Xac source. Via GIS analysis, dispersed inoculum was parsed into two groups: inoculum falling into areas void of citrus (Fig. 17B), and inoculum dispersal sites coinciding with commercial citrus (Fig. 17B, C). The resulting simulated distribution pattern (Fig. 17C) demonstrates less overall spatial heterogeneity compared to the actual distribution (Fig. 3B). More patchiness exists in the actual distribution due to a combination of primary hurricane dispersal and secondary local dispersal of the disease, whereas, the simulated distribution assumes only a single spatial process, i.e., hurricane dispersal. The simulation also does not account for other forms of local variation that can affect the spatial heterogeneity such as susceptibility of individual plantings and/or blocks within plantings due to cultivar differences, age, general health, and maintenance of the block, etc. The actual secondary local spread led to considerably more heterogeneity when viewed regionally. Also in the actual data, often a large number of Xac-infected trees exist in close proximity to one another and therefore cannot be discriminated in the overall regional diagram (Fig. 3B), whereas, the discrete infection sites predicted by the simulated distribution were selected stochastically and were more diffuse and therefore could more easily be discerned (Fig. 17C).
| |
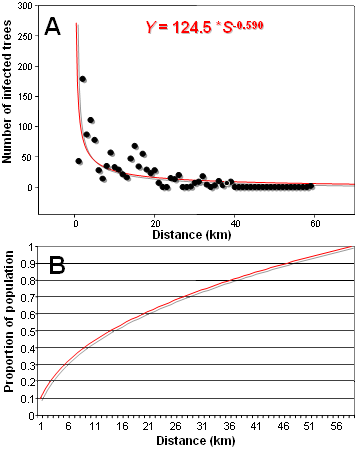
Fig. 16. Treasure Coast area data for number of Xac-infected trees versus distance from the source of infection (A) fitted to an inverse power law (IPL) dispersal model, and (B) cumulative proportion of the total population of Xac-infected trees by distance estimated using the IPL model representing hurricane dispersal of inoculum and subsequent infection with local spread. |
|
| |
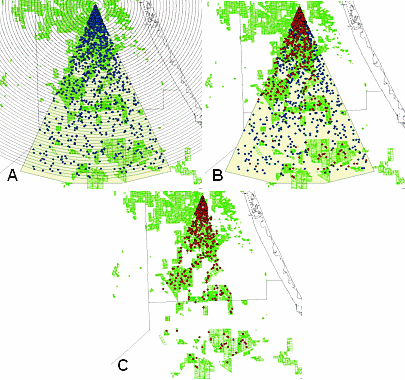
Fig. 17. Treasure Coast area simulation using a single point source of infection and assuming IPL distribution function of inoculum followed by infection. (A) inoculum dispersal by 1-km distance bands. The predicted population of infection sites were distributed stochastically within each band. (B) GIS analysis of distributed inoculum. Red dots indicate inoculum coinciding with commercial citrus, whereas blue dots indicate inoculum distribution into areas void of citrus. (C) IPL distribution of inoculum via IPL model into commercial citrus only. |
|
Each predicted point in the simulated dispersal event was considered an individual Xac-infected tree = focus. Each of these foci was then used as the center of a circular area. The radius of the circle would be the eradication distance from a known source of Xac. Various eradication distances (radii) were examined as alternative eradication protocols to the 579-m Florida statute. For regulatory purposes, these radii were set at 30.5-m (100-ft) increments. Using the Treasure Coast area, for each radius examined, the total areas of all of the individual circular areas was combined, redundant overlapping areas were deleted and the total combined area that coincided with commercial citrus plantings was calculated. The results were plotted and fitted to a second-order polynomial approximation for area impacted versus eradication radius and for percent of total acres impacted versus eradication radius (Fig. 18).
| |
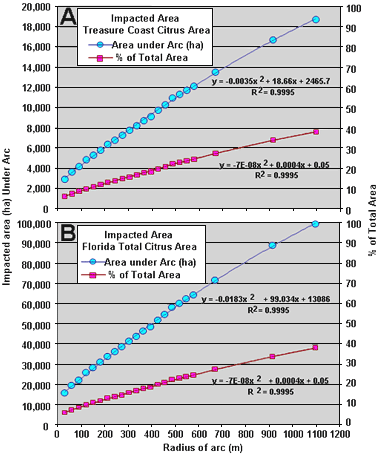
Fig. 18. Empirical model predictions of the area impacted by various citrus canker eradication protocol distances of removal surrounding Xac-infected trees for (A) Treasure Coast commercial citrus producing area, and (B) State of Florida total citrus producing area. |
|
Utilizing the IPL dispersal function for dissemination and calculating the overall impacted area resulted in very similar predictions compared to the GIS estimation method. However, as discussed above, the IPL function simulates only hurricane-mediated spread and does not take into account secondary spread from new foci of infection. As a result the area estimations based only on the IPL distribution of Xac of new infections are slightly less compared to GIS estimations. For the 579-m eradication protocol, the empirical estimation resulting for the IPL function results in a 24.6% impacted area prediction (64,262 ha = 158,794 acre) versus 25.6% (68,676 ha = 169,701 acre) predicted by the GIS estimation method, or 1.69% difference in total Florida commercial citrus area impacted. Similar to the GIS calculations for impacted area, the IPL function based calculations have implicit associated error and should not be considered absolute.
Epilog: Regulatory Considerations and Impact
Results of the study were reviewed by a team of scientists familiar with citrus canker biology, epidemiology, and eradication and subsequently by the two requesting agencies, FDACS-DPI and USDA-APHIS as well as the major Florida citrus grower associations in November and December of 2005. The caveats and assumptions used to formulate the predictions of impacted area were discussed at length but the inability for replication of hurricane events did not lend itself to generation of an error estimation related to the impacted area predictions. Thus the group decided to assume that as much as a 25% error in magnitude of impacted area values would be acceptable for decision making purposes. In addition, it would require a year or more post-hurricane and very large fiscal and manpower resources to survey and to determine the actual Xac dissemination and subsequent infection that resulted from Hurricane Wilma. However due to the urgent necessity for regulatory decision making this delayed time period for model validation was considered too hazardous. Two hazards were problematic: first the hazard of continued and exacerbated disease spread due to Wilma; and second the hazard of further eradication without prior agreement of an upper tolerance threshold for total area (number of acres) that the industry would agree to remove in an attempt to eradicate citrus canker and extending above which would trigger an end to the eradication program. Thus it was the decision of the regulatory agencies and commercial citrus producers to consider this study’s predictions as the best information available to use as a basis for decision making.
In the early 1980s the Florida citrus industry was approaching 404,686 ha (1 million acres ), but due to losses by freezes during the 1980s, combined with the impact of urbanization, hurricane wind damage, and past and pending losses associated with ACC eradication, the industry had declined to below 263,046 ha (650,000 acres) (7,22). It was the considerable concern of the commercial citrus industry that it could not continue to sustain additional losses in total production area due to Xac eradication and remain economically viable. The prediction of a potential ±25% additional loss in commercial area if post-Wilma eradication continued via the 1900-ft protocol identified by this study raised great concern and debate. The joint State/Federal Citrus Canker Eradication Program had spent nearly $1 billion for survey, eradication, and compensation over a 9+ year campaign to eradicate the disease. In addition, continued Federal funding by the US congress for eradication/compensation was predicated upon a program assessment of the continued feasibility of success of eradication. State and Federal agencies and commercial growers held numerous meetings to discuss the predictions and eventually came to consensus that the magnitude of potential losses to the commercial citrus industry due to ACC eradication was too great to continue an eradication program. These groups immediately turned to the possibility of using alternative eradication distances in lieu of the 579-m protocol, as presented in the study (Table 1). However, it was the general consensus that lesser eradication distances would nevertheless result in removal of an unacceptable portion of the remaining citrus industry, as well as lead to less effective eradication, prolonging eradication efforts, and further resulting in continued removals of commercial citrus areas over a protracted period.
Table 1. Inverse Power Law (IPL) function estimation of the citrus canker impacted area for the Treasure Coast and State of Florida commercial citrus producing areas considering various eradication protocols based on distance of removal of potential exposed trees surrounding known Xac-infected trees.
|
Dist.
(m) |
Dist.
(ft) |
Impacted area Treasure Coast only (ha) |
Impacted area Treasure Coast only (acre) |
Percent of total area |
Impacted area entire state (ha) |
Impacted area entire state (acre) |
| 30.5 |
100 |
2,935 |
7,253 |
5.95% |
15,578 |
38,494 |
| 61.0 |
200 |
3,635 |
8,983 |
7.37% |
19,293 |
47,675 |
| 91.4 |
300 |
4,149 |
10,252 |
8.41% |
22,019 |
54,410 |
| 121.9 |
400 |
4,824 |
11,920 |
9.78% |
25,603 |
63,266 |
| 152.4 |
500 |
5,301 |
13,100 |
10.75% |
28,135 |
69,524 |
| 182.9 |
600 |
5,806 |
14,348 |
11.77% |
30,816 |
76,149 |
| 213.4 |
700 |
6,359 |
15,714 |
12.89% |
33,751 |
83,401 |
| 243.8 |
800 |
6,793 |
16,786 |
13.77% |
36,054 |
89,091 |
| 274.3 |
900 |
7,265 |
17,953 |
14.73% |
38,560 |
95,285 |
| 304.8 |
1000 |
7,772 |
19,206 |
15.76% |
41,250 |
101,931 |
| 335.3 |
1100 |
8,214 |
20,297 |
16.65% |
43,593 |
107,722 |
| 365.8 |
1200 |
8,709 |
21,520 |
17.66% |
46,221 |
114,216 |
| 396.2 |
1300 |
9,111 |
22,513 |
18.47% |
48,354 |
119,485 |
| 426.7 |
1400 |
9,724 |
24,028 |
19.72% |
51,608 |
127,525 |
| 457.2 |
1500 |
10,264 |
25,363 |
20.81% |
54,474 |
134,608 |
| 487.7 |
1600 |
10,936 |
27,024 |
22.17% |
58,043 |
143,427 |
| 518.2 |
1700 |
11,308 |
27,944 |
22.93% |
60,018 |
148,307 |
| 548.6 |
1800 |
11,720 |
28,960 |
23.76% |
62,200 |
153,699 |
| 579.1 |
1900 |
12,108 |
29,920 |
24.55% |
64,262 |
158,794 |
| 670.6 |
2200 |
13,477 |
33,303 |
27.33% |
71,528 |
176,751 |
| 914.4 |
3000 |
16,691 |
41,244 |
33.84% |
88,584 |
218,896 |
| 1097.3 |
3600 |
18,713 |
46,242 |
37.94% |
99,319 |
245,423 |
x Values in blue represent the 579-m eradication protocol (Florida State Statute).
The above study and predictions were presented also at an International Workshop on Citrus Canker and Huanglongbing (another serious disease of citrus newly discovered in Florida) in November 2005. It was the consensus of this international group of researchers, with many combined years of experience with citrus canker, that the disease had spread too far and to too many locations, that the Xac bacteria had become endemic in the state of Florida, and therefore it was no longer feasible to continue eradication.
Due to the above considerations, USDA issued a press statement on 11 January 2006 indicating "USDA Determines Citrus Canker Eradication Not Feasible" (8). The state of Florida soon followed suit and unofficially halted further tree destruction. The situation culminated on 3 May 2006 with the unanimous decision by the Florida House of Representatives to halt the eradication campaign and repeal the 579-m (1900-ft) eradication statute, thus officially halting the citrus canker eradication program and a tumultuous era in plant pathology. Terminating the eradication program resulted in a cessation of funding for all phases of the eradication program including survey efforts, which was a workforce that fluctuated through time but until recently involved multiple hundreds of surveyors. Unfortunately, without this huge workforce, continued data collection for validation of this model will likely not occur.
Efforts have now turned to the development of a State-Federal-Commercial Industry Citrus Health Response Plan (CHRP), designed around best management practices for citrus canker and living with the disease while minimizing production losses (27). It has also resulted in discussions of an impending statewide quarantine prohibiting the shipment of fruit from all or some portions of Florida to other citrus producing states.
Literature Cited
1. Achor, D. S., Browning, H. W., Albrigo, L. G. 1996. Anatomical and histological modification in citrus leaves caused by larval feeding of citrus leaf miner (Phyllocnistis citrella Staint). Page 69 in: Proc. Int. Conf. Citrus Leafminer, Orlando, Florida, April 23-25, 1996. Univ. of Fla., Gainesville, FL.
2. Belasque, J., Parra-Pedrazzoli, A. L., Rodrigues Neto, J., Yamamoto, P. T., Chagas, M. C. M., Parra, J. R. P., Vinyard, B. T., Hartung, J. S. 2005. Adult citrus leafminers (Phyllocnistis citrella) are not efficient vectors for Xanthomonas axonopodis pv. citri. et al. Plant Dis. 89:590-594.
3. Bergamin-Filho, A., Amorim, L., Laranjeira, F. F., and Gottwald, T. 2000. Epidemiology of citrus canker in Brazil with and without leafminer. Page 6 in: Proc. of the Intl. Workshop on Citrus Canker, Ft. Pierce, FL, June 2000.
4. Bock, C. H., Parker, P. E., and Gottwald, T. R. 2005. Effect of simulated wind-driven rain on duration and distance of dispersal of Xanthomonas axonopodis pv. citri from canker infected citrus trees. Plant Dis. 89:71-80.
5. Division of Plant Industry. 2006. Citrus canker eradication program history report. Online. Fla. Dept. of Agric. and Consumer Serv., Tallahassee, FL.
6. Division of Plant Industry. 2006. Citrus canker quarantine maps. Online. Fla. Dept. of Agric. and Consumer Serv., Tallahassee, FL.
7. Division of Plant Industry. 2006. Hurricane impact to agricultural industry. Online. Fla. Dept. of Agric. and Consumer Serv., Tallahassee, FL.
8. Division of Plant Industry. 2006. USDA Determines citrus canker eradication not feasible. Online. Fla. Dept. of Agric. and Consumer Serv., Tallahassee, FL.
9. Gottwald, T. R., Graham, J. H., and Egel, D. S. 1992. Analysis of foci of Asiatic citrus canker in a Florida citrus orchard. Plant Dis. 76:389-96
10. Gottwald, T. R., Graham, J. H., and Schubert, T. S. 1997. An epidemiological analysis of the spread of citrus canker in urban Miami, Florida, and synergistic interaction with the Asian citrus leaf miner. Fruits 52:383-390.
11. Gottwald, T. R., Graham, J. H., and Schubert, T. S. 1997. Citrus canker in urban Miami: An analysis of spread and prognosis for the future. Citrus Industry 78:72-78.
12. Gottwald, T. R., Graham, J. H., and Schubert, T. S. 2002. Citrus canker: The pathogen and its impact. Online. Plant Health Progress doi:10.1094/PHP-2002-0812-01-RV.
13. Gottwald, T. R., Hughes, G., Graham, J. H., Sun, X., Riley, T. 2001. The citrus canker epidemic in Florida: The scientific basis of regulatory eradication policy for an invasive species. Phytopathology 91:30-4
14. Gottwald, T. R., Sun, X., Riley, T. D., Graham, J. H., Ferrandino, F., and Taylor, E. L. 2001. Geo-referenced, spatiotemporal analysis of the urban citrus canker epidemic in Florida. Phytopathology 92:361-377.
15. Graham, J. H., and Gottwald, T. R. 1991. Research perspectives on eradication of citrus bacterial diseases in Florida. Plant Dis. 75:1193-1200.
16. Graham, J. H., Gottwald, T. R., Browning, H. S., and Achor, D. S. 1996. Citrus leafminer exacerbated the outbreak of Asiatic citrus canker in South Florida. Page 83 in: Proc. Intl. Conf. Citrus Leafminer, held in Orlando, Florida, April 23-25, 1996. Univ. of Fla., Gainesville.
17. Graham, J. H., Gottwald, T. R., Cubero, J., and Achor, D. 2004. Xanthomonas axonopodus pv. citri: Factors affecting successful eradication of citrus canker. Molec. Plant Pathol. 5:1-15.
18. Heppner, J. B. 1993. Citrus leafminer, Phyllocnistis citrella, in Florida (Lepidoptera: Gracillariidae: Phyllocnistinae). Trop. Lepid. 4:49-64.
19. Heppner, J. B. 1993. Citrus leafminer, Phyllocnistis citrella Stainton (Lepidoptera: Gracillariidae: Phyllocnistinae). Fla. Dept. Agric. & Consumer Serv., Div. of Plant Industry. Entomol. Cir. 359.
20. Knapp, J., Peña, J., Stansly, P., Heppner, J., and Yang, Y. 1994. The citrus leafminer, Phyllocnistis citrella, a new pest of citrus in Florida. Univ. Fla., Inst. of Food and Agric. Serv. SP 156.
21. Irey, M., Gottwald, T. R., Graham, J. H., Riley, T. D., and Carlton, G. 2006. Post-hurricane analysis of citrus canker spread and progress towards the development of a predictive model to estimate disease spread due to catastrophic weather events. Online. Plant Health Progress doi:10.1094/PHP-2006-0822-01-RS.
22. National Hurricane Center. 2006. Hurricane history. Online. Hurricane Preparedness. Nat. Oceanic & Atmospheric Admin. (NOAA), Nat. Weather Service, Miami, FL.
23. National Weather Service. 2006. 2006 Atlantic hurricane outlook. Online. NOAA Press Release, 22 May 2006. Nat. Oceanic & Atmospheric Admin. (NOAA), Climate Prediction Center, Camp Springs, MD.
24. National Weather Service. 2005. 2005 Atlantic hurricane season. Online. Nat. Oceanic & Atmospheric Admin. (NOAA), Nat. Hurricane Center, Miami, FL.
25. Pasch, R. J., Blake, E. S., Cobb H. D., and Roberts, D. P. 2006. Online. Tropical cyclone report, Hurricane Wilma, 15-25 October 2005. Nat. Hurricane Center, Nat. Oceanic & Atmospheric Admin. (NOAA), US Dept. of Commerce, Washington, DC.
26. Parker, P. E., Bock, C. H., and Gottwald, T. R. 2005. Comparison of techniques to sample citrus canker bacterial (Xanthomonas axonopodis pv citri) in wind-blown spray. Plant Dis. 89:1324-1330.
27. Plant Protection and Quarantine (PPQ). 2006. Citrus health response plan. Online. Plant Health, Plant Pest Information, Citrus Programs. USDA-APHIS, Washington, DC.
28. Schubert, T. S., Rizvi, S. A., Sun, X., Gottwald, T. R., Graham, J. H., and Dixon, W. N. 2001. Meeting the challenge of eradicating citrus canker in Florida-Again. Plant Dis. 85:340-356.
29. Serizawa, S., and Inoue, K. 1974. Studies on citrus canker, Xanthomonas citri. III. The influence of wind on the infection of citrus canker. Bull. 11:54-67. Shizuoka Prefect. Citrus Exp. Stn., Komagoe Shimizu City, Japan.
30. Timmer, L. W., Gottwald, T. R., and Zitco, S. E. 1991. Bacterial exudation from lesions of Asiatic citrus canker and citrus bacterial spot. Plant Dis. 75:192-195.

