
The following calculations are used to analyze numerical data used to assign a positive or negative diagnosis. These calculations supplement others described in the DAVN Stats Toolbox (i.e., diagnostic sensitivity, diagnostic specificity, and global accuracy).
Definitions of Performance Characteristics
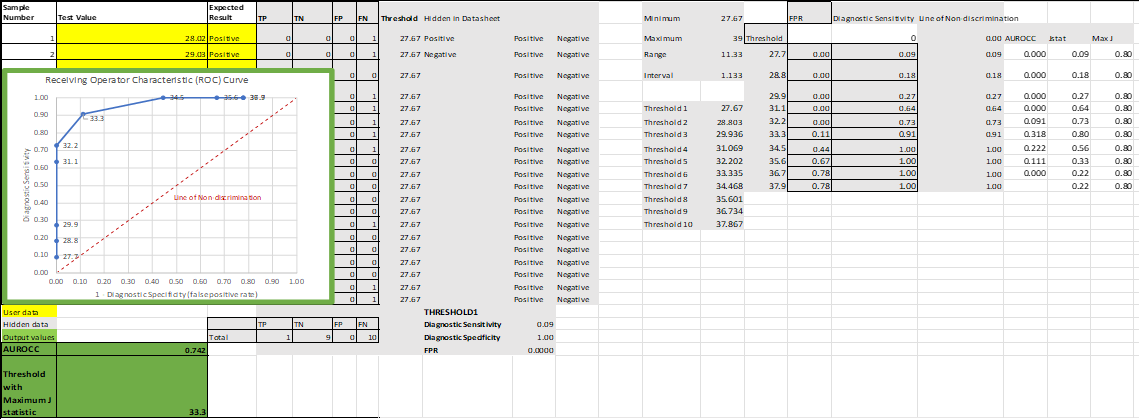
Threshold
Measured value distinguishing between negative and positive test results. This value is selected based on consideration of a test’s precision and accuracy data.
Assessing Accuracy with Variable Thresholds
Accuracy can be visualized graphically across a range of threshold values using
Receiving Operator Characteristic (ROC) curves. A ROC curve plots diagnostic sensitivity by the false positive rate (1 – diagnostic specificity). This graph can be used as an aid for comparing the performance of competing diagnostic assays as well as an aid in determining a suitable diagnostic threshold value.
- A curve that is shifted right has a higher false positive rate.
- A curve with a lower maximum amplitude is less sensitive.
- A curve that is a diagonal line would represent a test whose accuracy is the same as random chance (line of no discrimination).
The
area under the ROC Curve (AUROCC or concordance statistic) also informs a user about a test's accuracy across variable thresholds. The AUROCC value gives an estimation of the likelihood that a test method will give a correct diagnosis under robustness conditions.
- If the AUROCC is 1, then the test has at least one threshold that perfectly predicts the presence or absence of the test target.
- If the AUROCC is 0.5 or less, the test has no predictive power.
Youden's J Statistic
A measure of the informedness of a test1. A J statistic value of 1 indicates a test with perfect accuracy (no false positives or false negatives) whereas a J statistic value of 0 indicates a test of no predictive value.
J = diagnostic sensitivity + diagnostic specificity -1
Data Input – Single Test
Total number of positive and negative samples = _____ (number entered used to generate rows in table below)
Calculator Coming Soon!
Data Input – Multiple Tests
It is recommended to design a ROC experiment that uses the same panel of test samples across multiple tests. The accuracy values show how tests differ. These differences inform the suitability of a test for broader use in two ways:
- Several prototype assays can be tested against the same set of validation samples to see which prototype is more accurate. Prototypes could have differing test reagent concentrations, components, temperatures, etc.
- A novel assay can be compared against published tests to see if the new test is an improvement.
Total number of positive and negative samples = _____ (number entered used to generate rows in table below)
Total number of tests to be compared = ________ (number entered used to generate columns in table below)
*Tests must use the same technology and produce similar ranges of data.
Calculator Coming Soon!
Interpreting Results
The ROC curve can be used to aid a developer in setting a diagnostic threshold for a test. Where false positives and false negatives are equally significant in a diagnostic protocol, the threshold can be determined by calculating Youden's J statistic. The threshold that produces the maximum value of J will produce a test with maximum informedness.
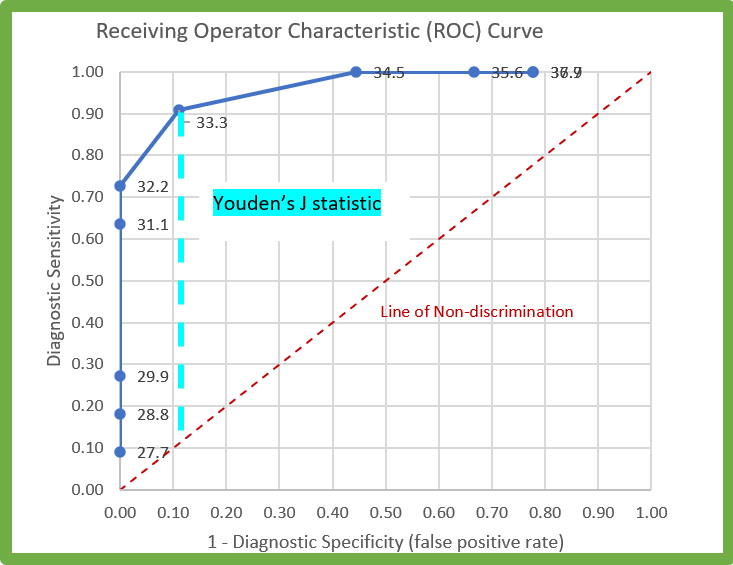
In the example above, the diagnostic threshold would be 33.3.
- Any sample producing a value below 33.3 would be considered positive.
- Any sample producing a value greater than 33.3 would be considered negative.
- Every test has an inherent uncertainty of measurement. Where this can be quantified (see calculator for Precision), this error should be considered when interpreting results near the threshold chosen.
- For example, if the above test has a Confidence Interval of +/- 0.3, a sample producing a value between 33.0 and 33.6 could be considered inconclusive. Inconclusive results may warrant further analysis depending on intended use of the assay.
When comparing multiple tests on a single ROC graph, curves with greater AUROCC scores will generally prove more accurate when higher variance in the result data is expected. This can be expected when a test is used by multiple operators with varying equipment. The closer that the AUROCC is to 1, the greater the likelihood of a successful adoption of a new assay.
References:
-
Powers, David. 2011. Evaluation: From Precision, Recall and F-Score to ROC, Informedness, Markedness & Correlation. Journal of Machine Learning Technologies. 2 (1): 37–63.

