
The following calculations provide end users information on a qualitative test method's sensitivity. Qualitative test methods give a positive or negative diagnosis, regardless of whether the assay produces numerical values. Sensitivity calculations differ depending on whether the results are binary data (presence or absence) or numerical results (Cq values, OD values, etc.).
Analytical sensitivity expresses the percentage of target concentrations detected. This performance characteristic is useful when comparing test sensitivity between users or assays. The limit of detection data informs test users of the minimal analyte concentration detected in certain conditions.
Definitions of Performance Characteristics
Analytical Sensitivity
KEYTPR = True Positive Rate (also known as positivity)
Si = standard deviation
TPi = # True Positives among
ni results
ni = number of results for dilution
i in a serial dilution
xi = test result for
ith dilution
isat = last dilution in a dilution series where 100% sensitivity is observed (saturation dilution)
Limit of detection that is consistently observed
% sensitivity =
TPR[isat, isat + 1] x 100
where
TPR[isat, isat + 1] = (TPRisat +
TPisat+1) / (nisat +
nisat +1)
Limit of Detection (LOD)
The lowest concentration of target that can be detected
For tests with numerical results denoted
x1, x2, ..., xn:
% sensitivity at dilution
i, x̄i ±
si
where dilution
i represents a minimal concentration
For binary tests:
% sensitivity at dilution
i, where dilution
i represents a minimal concentration
Calculating Sensitivity
Analytical Sensitivity Data Input - Numerical Data that Increases in Value as Target in Diluted (ex.: CT value with qPCR)
Calculator - Inversely Correlated Numerical Data
Analytical Sensitivity Data Input - Numerical Data that Decreases in Value as Target is Diluted (ex.: ELISA, RPA, HTS)
Calculator - Correlated Numerical Data
Analytical Sensitivity Data Input - Positive/Negative Binary Data (ex.: Gel images, Conventional PCR, etc.)
Calculator - Binary Data
Reporting Results
For any test, analytical sensitivity is reported as a percentage within a range of analyte concentrations. The total number of data points is also reported.
Example: Test analytical sensitivity is 95.8% at 10 ng/mL to 1 ng/mL of DNA (n=24).
For tests that produce a binary result (positive or negative diagnosis), LOD is reported as the percent positivity at a specific analyte concentration. The total number of data points is also reported.
Example: The test had a LOD of 10 ng/mL protein (100% positivity, n=12). At 1 ng/mL, the senstivity decreased to 91.7%.
For numerical values, such as a cycle number or OD value, LOD is reported as the concentration of analyte with measurement error and percent positivity. The total number of data points is also reported.
Example: The test had a LOD of 1 ng/mL total nucleic acid (91.7% positivity, Ct 27.4 +/- 1.53, n=12). At 100% positivity, the LOD was found to be 10 ng/mL (23.9 +/- 0.14, n=12).
Interpreting Results
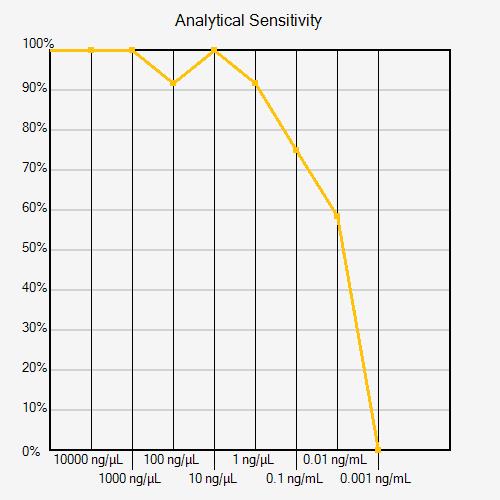
Technical errors can affect analytical sensitivity calculations. If a dilution has a positivity rate that is greater than the previous (more concentrated) dilution, this may indicate a technical error, as seen in the Analytical Sensitivity Curve below (dilution 100 ng/mL). If there is a clear reason for the error identified by the operator (pipetting error, known cross-contamination, or incorrect use of reagents, for example), the data point can be removed. If there is not a clear reason for the error, it is recommended that the experiment be repeated with additional replicates to confirm whether a technical error occurred or the result is real.
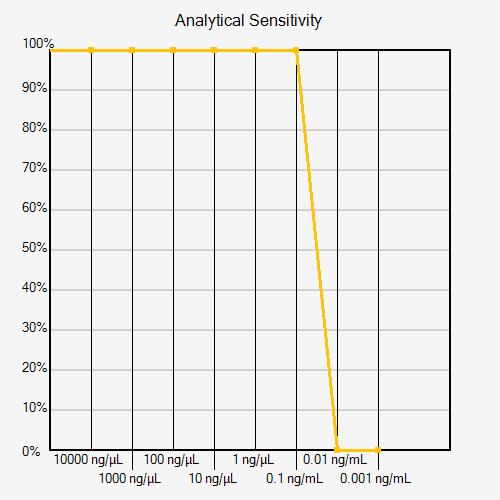
More than one dilution series may be needed to determine analytical sensitivity within a desired concentration range. If the positivity rate decreases from 100% to 0% from one dilution to the next, the series has poor resolution (see figure below).
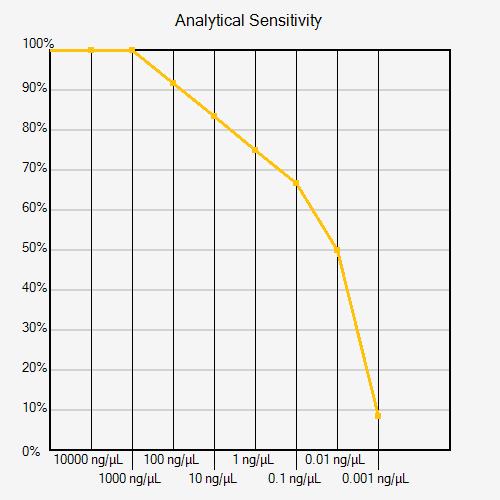
A second experiment with a narrower analyte concentration range can improve analytical sensitivity resolution (see figure below).
The reported LOD depends on the intended use of the assay. If the test is used to screen for an analyte at a low concentration, a user will want confidence that the test did not “miss” a positive sample. Alternatively, if the risk associated with reporting a false negative result is consequential, then an LOD with a higher percent positivity may be desired. However, if the test is used in an application where any positive result is of consequence, even in trace amounts, then an LOD with a positivity rate above 50% (random chance) may be reported.

