If, as we have stated, our goal in plant disease management is to keep disease development below an acceptable level and therefore to understand disease progress in quantitative terms, it will be necessary to find some kind of mathematical model to describe the epidemic. Our model should show how some variable, preferably something that we can count or measure in the real world, changes with time. From the management perspective, keeping track of new infections perhaps would be the most useful, but actually observing these microscopic events in most cases would be too difficult to be practical. Monitoring inoculum is also very useful for disease management, and for many diseases practical techniques have been developed for quantifying inoculum. We will begin our discussion, therefore, with changes through time in the amount of inoculum available to cause disease.
Monocyclic Inoculum Production
In monocyclic epidemics we are interested primarily in the inoculum present at the beginning of each season (initial inoculum). If we let Q1 represent the quantity of initial inoculum at the beginning of the current season, it will be equal to the quantity of initial inoculum at the beginning of the previous season, Q0, plus the increment that has resulted from the pathogen's growth and development during the season:
Q1 = Q0 + increment
The increment will be a function of the quantity of last season's initial inoculum, and a reasonable approximation is to make it a simple proportion of last season's initial inoculum, KQ0, where K is a proportionality constant:
Q1 = Q0 + KQ0
Embodied in K are all the factors affecting survival and growth of the fungus, propagule production, dispersal of inoculum, and death of the fungus. The value of K depends on a large number of factors, including environmental conditions, crop development, and cultural practices. If there is a net increase in the inoculum from one season to the next, K will be positive. If, on the other hand, there is a net loss of inoculum, such as might occur during a rotation to a nonhost crop, K would be negative.
In order to describe the changes in the initial inoculum from one season to the next in a polyetic epidemic, we will generalize the subscript that indicates the season.
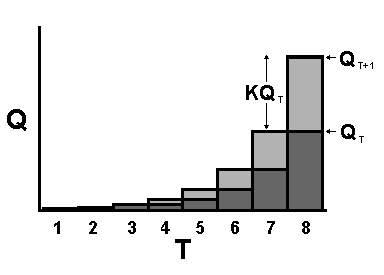
QT+1 = QT + KQT
We solve this equation repetitively, changing the subscript T, indicating time, with each successive season and making the current value of QT+1 the value of QT in the subsequent season. In order to simplify the equation, we assume a constant K (an average over many seasons). The above equation gives the following graph:

Note that if K is positive, the increment (the light grey area on each bar) increases with the initial inoculum in each successive season, and the graph appears to curve upward.
Polycyclic Inoculum Production
For a polycyclic epidemic we can use essentially the same model as for a monocyclic pathogen viewed over several seasons, where instead of repeating the cycle season after season, we have many repeated cycles within the same season. The time step becomes days or weeks instead of years, and since the time steps are no longer necessarily one time unit (years), the time increment is given as ΔT.
qT+ΔT = qT + qTk⋅ΔT
As a matter of notation, we will use a lower case q to represent the quantity of inoculum during the epidemic and a lower case k to represent the proportion by which inoculum increases in each time step. The units of k correspond to the units of T. For example, if the time is measured in days, the units of k would be proportion/day.
Inoculum production actually tends to occur irregularly in discontinuous, discrete infection periods of differing lengths, depending on the weather, and the value of k would likely be different for each infection period. However, in keeping with our objective of developing the simplest model possible to be useful as a management tool, we will simplify the above model by using uniform time steps and assuming a constant k. (Instead of having a k that varies according to the environmental conditions, we will use a value of k "averaged" over the whole epidemic.) We will first rearrange the above equation to get:
qT+ΔT - qT = qTk⋅ΔT
The change in the amount of inoculum in one time step, Δq, is simply the difference between the amount of inoculum at time T and the amount of inoculum at time T+ΔT:
Δq = qTk⋅ΔT
Rearranging we get:
Δq/ΔT = qTk
Now instead of advancing time in discrete steps, we will advance time continuously, making ΔT infinitesimally small:
dq/dt =qk
In this differential equation, dq is an infinitesimally small change in the quantity of inoculum, and dt is an infinitesimally small change in time. It tells us that the rate of change of the quantity of inoculum is proportional to the quantity of inoculum at any point in time. Using the calculus, this equation can be integrated to:
q = q0ekt

This, we see, is the familiar exponential function, where q0 is the initial inoculum, and e is the base of the natural (Napierian) logarithm. The instantaneous rate of change in q is dq/dt, the slope of the tangent to the curve at any point.
Next: Modelling Disease Progress
